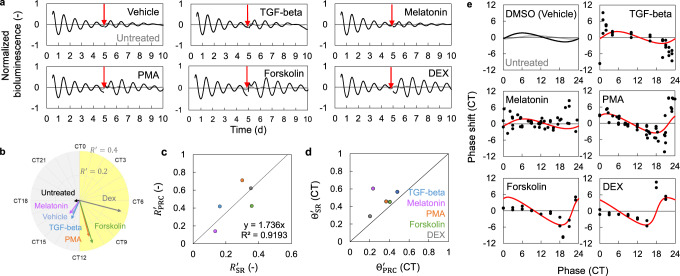
Fig. 4. PRC estimation in Rat-1 cells.
a Normalized bioluminescence in Rat-1 Bmal1-luc cells (Mean, n = 8 biologically independent samples (Untreated), 6 (Vehicle), 10 (others)) showing SRs to various stimuli. Cells were treated with vehicles or indicated chemicals (2 ng/ml TGF-beta, 20 nM melatonin, 10 μM PMA, 10 μM forskolin or 100 nM DEX). Black and gray lines indicate the rhythms w/wo stimulation, respectively. Red arrows indicate the time of the stimulation. b Amplitude and phase of SRs. The distance from the center point represents amplitude, and the angle represents the phase. The peak time of Bmal1-luc activity was defined as CT0. c Amplitude of PRCs and SRs. The linear black line is the regression line for calibration parameter β in Eq. (7). R2 is the coefficient of determination. d Phase of PRCs and SRs. The linear black line indicates the line of y = x. e Measured PRCs and estimated PRCs. Points indicate the measured phase responses and solid curves indicate the estimated PRCs.

