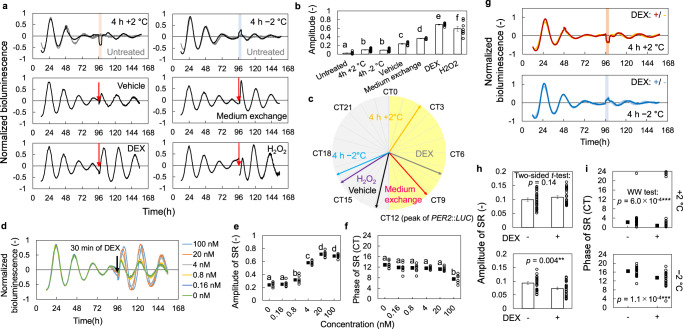
Fig. 5. Evaluation of phase response properties using SRs in MEF PER2::LUC.
a SRs to indicated stimulations. Red arrows and colored region indicate time of stimulation. The concentration of dexamethasone (DEX) and H2O2 were 100 nM and 2 mM, respectively. b Amplitude of SRs (n = 5 biologically independent samples in medium exchange, 24 in temperature stimulation and 8 in the others, Mean ± SEM). Each two conditions with different letters represent significant differences (Tukey–Kramer test, p < 0.05). c Phase of SRs (the peak of PER2::LUC was defined as CT12). d SRs to DEX treatment for 30 min at various concentrations. Dose effects of DEX on amplitude (e) and phase (f) of SRs (n = 8 biologically independent samples, mean ± SEM in e and circular mean in f). Each two conditions with different letters are significantly different (Tukey–Kramer test in e and Watson–Williams test (WW test) with Bonferroni correction in f, p < 0.05). g Normalized luminescence during the SR measurement for the temperature stimuli with and without prior DEX treatment. Amplitude (h) and phase (i) of SR for temperature stimuli with/without prior synchronization using DEX (n = 24 biologically independent samples, mean ± SEM in h and circular mean in i).

