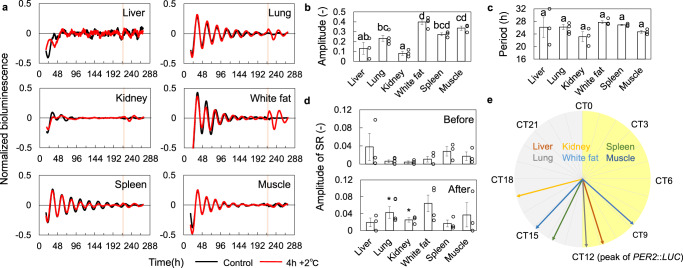
Fig. 6. SRs for heating stimulation in slice cultures.
a SRs of different tissues to 4 h + 2 °C stimulation. Red and black lines indicate the rhythms with and without stimulation, respectively. Vertical bars indicate temperature stimuli. Amplitude (b) and period (c) of each tissue (mean ± SEM, n = 4 independent experiments for lung and white fat and 3 for the others). Each two condition with different letters represents significant differences (Tukey–Kramer test, p < 0.05). d The amplitude before and after the stimulation (mean ± SEM, n = 4 independent experiments for lung and white fat, n = 3 independent experiments for the others). Asterisks indicate significant differences (t-test, p < 0.05). e Phase of SRs in different tissues (circular mean).

