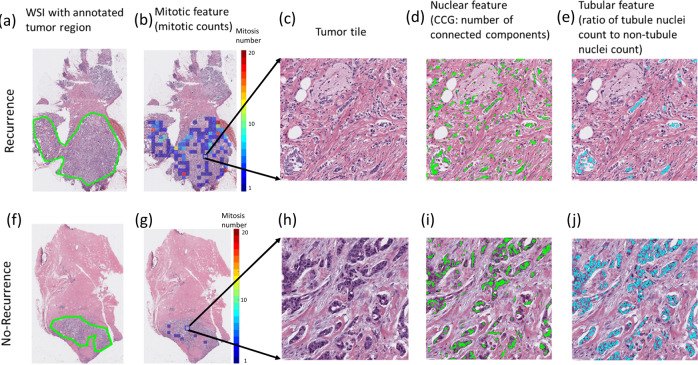
Fig. 2. Representative H&E WSI comparison of a recurrent (top row) and a censored (bottom row) patient.
The first column (a, f) shows the original WSI with the pathologist-annotated tumor region. The second column (b, g) illustrates the distribution of mitotic counts on the WSI with warmer color in the scale bar indicating a higher mitosis number. The third column (c, h) is a magnified view of a tumor tile. The fourth column (d, i) demonstrates the top-identified nuclear feature, which quantifies the number of connected nuclei clusters (connected in green line). The fifth column (e, j) shows the tubule feature “ratio of tubule nuclei count to non-tubule nuclei count” with tubule nuclei highlighted in cyan.

