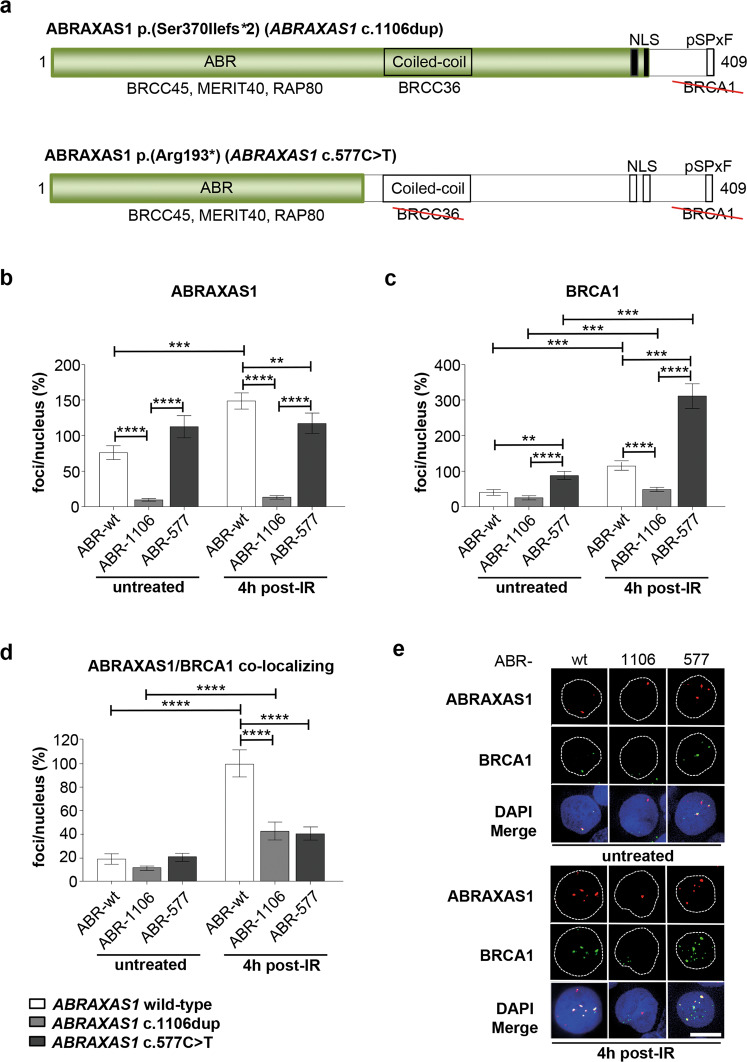
Fig. 1. Analysis of ABRAXAS1- and BRCA1-foci accumulation in response to IR.
Wild-type ABRAXAS1 (ABR-wt: white), ABRAXAS1 c.1106dup-mutated (ABR-1106: light grey) and ABRAXAS1 c.577C>T-mutated (ABR-577: dark grey) LCLs were either exposed to γ-irradiation with a dose of 2 Gy (IR) followed by cultivation for 4 h or left untreated. Foci per nucleus were scored by automated quantification of 50 nuclei from three independent experiments each and normalized to the mean foci numbers per nucleus calculated from irradiated wild-type LCLs (ABR-wt and external control BR-0968) measured on the same day, which were defined as 100%. GraphPad Prism software was used for graphic presentation and calculation of statistically significant differences via Kruskal–Wallis test followed by two-tailed Mann–Whitney U test comparing mean values in ABR-wt, ABR-1106 and ABR-577 under untreated or IR-treated conditions. Columns show mean values; n = 150; bars, SEM; **P < 0.01, ***P < 0.001, ****P < 0.0001. a Schematic drawings visualizing the truncated mutant proteins ABRAXAS1 p.(Ser370Ilefs*2) encoded by ABRAXAS1 c.1106dup with deletion of the C-terminal BRCA1-interaction site (comprising a SPTF motif, amino acids 406–409, [23]) and of ABRAXAS1 p.(Arg193*) encoded by ABRAXAS1 c.577C>T additionally devoid of the BRCC36-interaction site (amino acids 200–270, [65]). Both proteins retain most of the ABR domain mediating interactions with BRCC45, MERIT40 and RAP80. Green, truncated proteins; NLS nuclear localization signal, pSPTF phosphoserine motif that binds to the BRCT domains of BRCA1 [23]. b Graphic presentation of ABRAXAS1-foci per nucleus (absolute values corresponding to 100%: 4.2). c Graphic presentation of BRCA1-foci per nucleus (absolute values corresponding to 100%: 5.6). d Graphic presentation of ABRAXAS1/BRCA1 co-localizing foci (absolute values corresponding to 100%: 4.8). e Representative images of ABRAXAS1 (red) and BRCA1 (green) in DAPI-stained nuclei (blue). The scale bars here and further on represent 10 μm.

