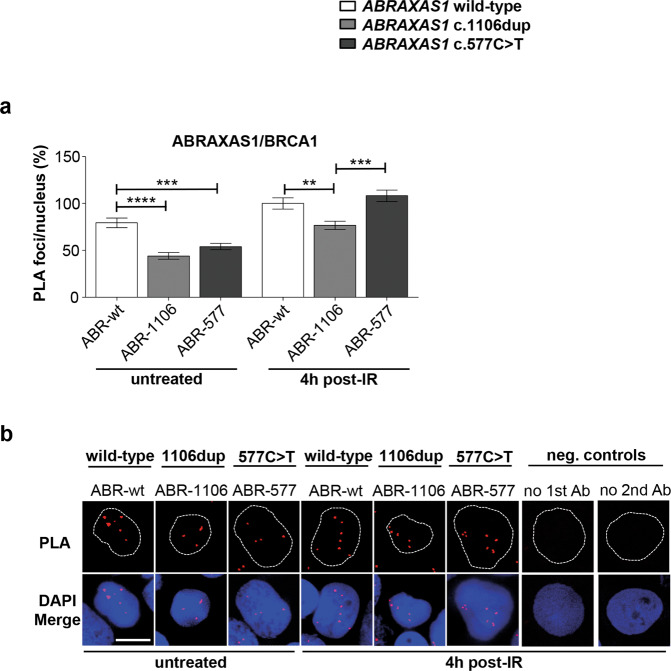
Fig. 2. Analysis of BRCA1 and ABRAXAS1 associations.
Association between BRCA1 and ABRAXAS1 was examined in LCLs ABR-wt, ABR-1106 and ABR-577 with wild-type ABRAXAS1 (white columns), with ABRAXAS1 c.1106dup (light grey column) and ABRAXAS1 c.577C>T (dark grey column), respectively, via PLA. LCLs were either exposed to IR and re-cultivated for 4 h or left untreated. PLA-foci were scored by automated quantification of 100 nuclei for each time-point in three independent experiments each and normalized to the mean PLA-foci values of the wild-type control ABR-wt 4 h post IR (absolute values corresponding to 100%: PLA, 7.3). Columns show mean values; n = 300; bars, SEM; **P < 0.01, ***P < 0.001; ****P < 0.0001. Statistically significant differences were calculated via Kruskal–Wallis test followed by two-tailed Mann–Whitney U test comparing mean values for different LCLs. a Graphic presentation of ABRAXAS1/BRCA1 PLA-foci per nucleus (%). b Representative images of PLA-foci (red) using primary antibodies anti-BRCA1 (mouse) and anti-ABRAXAS1 (rabbit) in DAPI-stained nuclei (blue). Negative controls without the primary (1st) and secondary (2nd) antibody (Ab), respectively, were performed to validate the specificity of the stainings.

