Fig. 3.
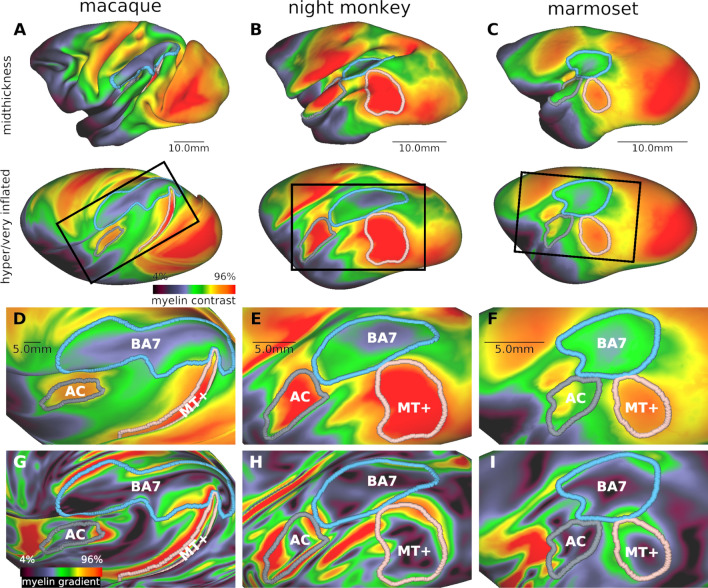
Interspecies comparison of myeloarchitecture in parieto-temporal cortex. T1w/T2w myelin contrast in A macaque, B night, and C marmoset monkeys displayed on a mid-thickness surface (top row) and a hyper inflated (A) or very inflated (B, C) surface (bottom row). Rectangles indicate the zoomed view of the parieto-temporal cortex in (D, E, F) T1w/T2w myelin contrast, and (G, H, I) gradient. Note that the shape, topography, and relative area of the MT + complex (MT + ; pink), auditory cortex (AC; gray), and Brodmann area 7 (BA7; cyan) substantially vary across NHP species. Data at https://balsa.wustl.edu/88Pzx

