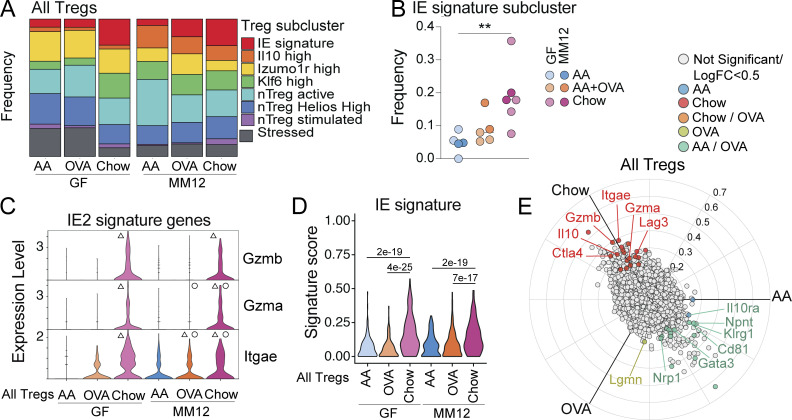
Figure 3.
Chow diet imprints an epithelial transcriptional signature on intestinal Tregs. scRNAseq of 1,183 IE and LP Tregs from GF or Oligo-MM12 mice fed AA, AA + OVA, or standard chow diet with two to four mice per condition. (A and B) Frequency of cells in each Treg subcluster (A) or in the IE signature subcluster (B). One-way ANOVA displaying with Tukey’s multiple comparisons test, **P < 0.01. (C) Treg expression (Pearson residuals) of IE2 signature genes, grouped by condition. Wilcoxon rank sum test with Bonferroni correction for multiple comparison, P-adj < 1e−5 were considered statistically significant. Groups labeled with a triangle (Δ) are significantly higher than AA diet mice within the same colonization group. Groups labeled with a circle (∘) are significantly higher than GF mice from the same dietary group. (D) Treg IE gene signature score grouped by condition. Each data point contributing to the violin plots represents a single sequenced cell. Wilcoxon rank sum test with P-adj < 1e−5 within each colonization group displayed on the plot. (E) Three-way volcano plot showing differential gene expression between diets in all Tregs. Colored genes are differentially expressed (P-adj < 0.05 from FDR-corrected Kruskal–Wallis Test and log2 fold change > 0.5), colored by the diet(s) in which they are upregulated. Select genes of interest are labeled on each plot.

