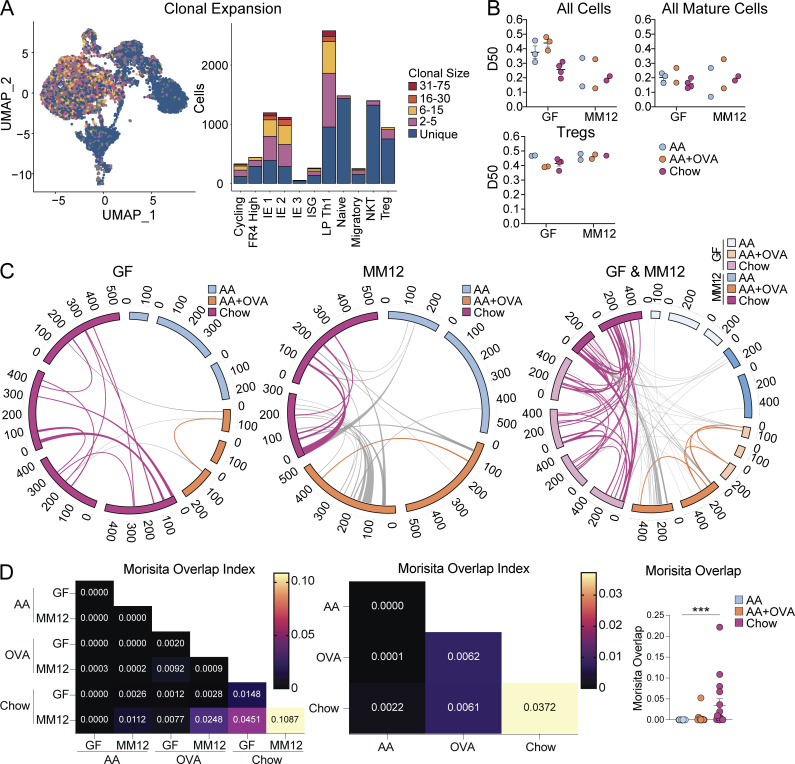
Figure 5.
Exposure to dietary protein drives clonal selection of intestinal CD4+ T cells. scTCRseq of 12,139 IE and LP CD4+ T cells from GF or Oligo-MM12 mice fed AA, AA + OVA, or standard chow diet using two to four mice per condition. (A) Clonal expansion (by TCR nucleotide sequence) of cells visualized by UMAP (left) and bar plot of gene expression clusters (right). (B) D50 in which repertoires are scored from 0 (least diverse) to 0.5 (most diverse) within all cells (top left), mature clusters IE1, IE2, IE3, and LP Th1 combined (top right), and Tregs (bottom left). (C and D) Clonal sharing between mice defined by paired TCRα and TCRβ CDR3 amino acid sequence. NKT cells were discarded from analysis. (C) Circos plots in which each segment represents a mouse, colored by diet and sized by cell count. Links between segments represent public clones which are colored by diet if shared between mice of the same diet or uncolored if shared between mice of different diets. (D) Morisita overlap index heatmaps where each square represents the mean overlap between each mouse in the indicated conditions (left and center) or scatter plot where each dot represents overlap between mice in the same diet (right). Kruskal–Wallis test with Dunn’s multiple comparisons, ***P < 0.001.

