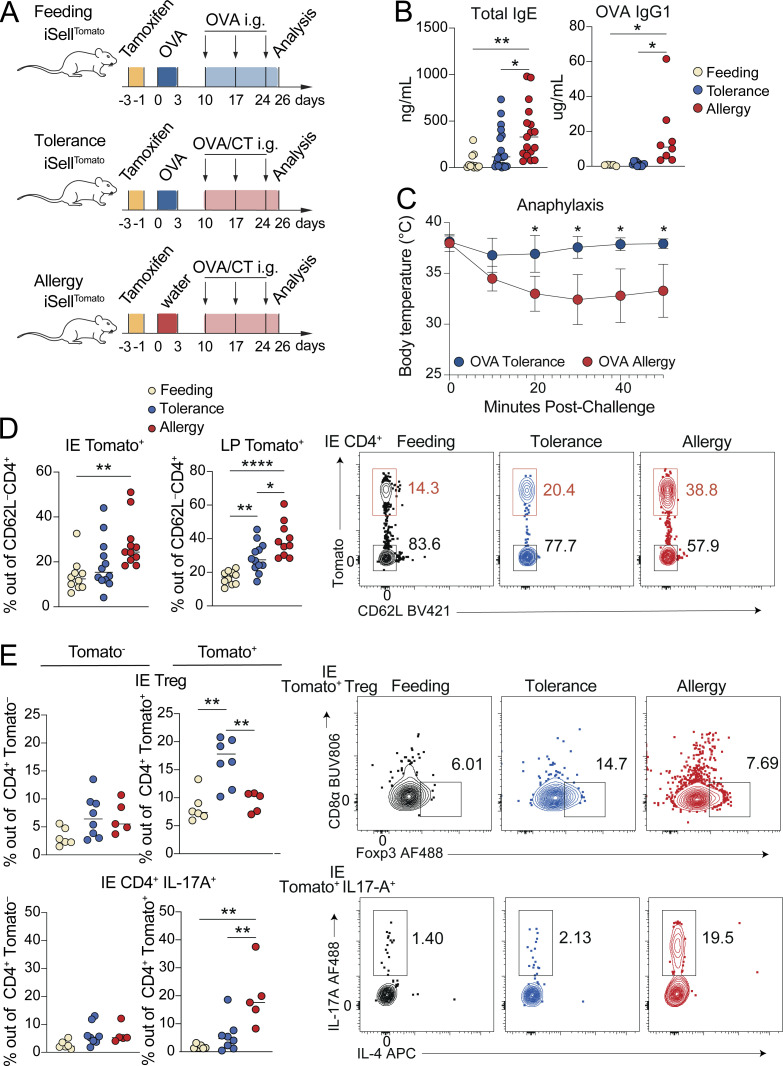
Figure 6.
Tracking intestinal CD4+ T cell responses during OVA feeding, tolerance, or allergy. iSellTomato mice were analyzed on day 26 after treatment with tamoxifen to permanently label naïve T cells and then exposure to OVA in the context of feeding, tolerance, or allergy. (A) Schematic of experimental protocol. (B) Total serum IgE (left) or OVA specific IgG1 (right) as measured by ELISA. One-way ANOVA displaying P < 0.05 from Tukey multiple comparison test. Data is representative of two–three independent experiments with 4–13 mice per group. (C) Anaphylaxis as measured by body temperature of mice at the indicated times after intraperitoneal OVA injection, following four weekly doses of OVA/CT. Mean ± SEM representative of two independent experiments with five to six mice per group. Unpaired t tests with Holm-Šidák multiple comparison test. (D and E) Flow cytometry measuring frequency of Tomato+ out of total CD4+ T cells in the IE or LP (D) or of the indicated CD4+ T cell subsets out of Tomato+ or Tomato− CD4+ T cells in the IE (E) with representative flow cytometry plots shown on the right. Mean from four (D) or two (E) independent experiments with 10–12 (D) or 5–8 (E) mice per group. One-way ANOVA with Tukey’s multiple comparison test, showing P values < 0.05. (B−E) *P < 0.05, **P < 0.01, ****P < 0.0001.

