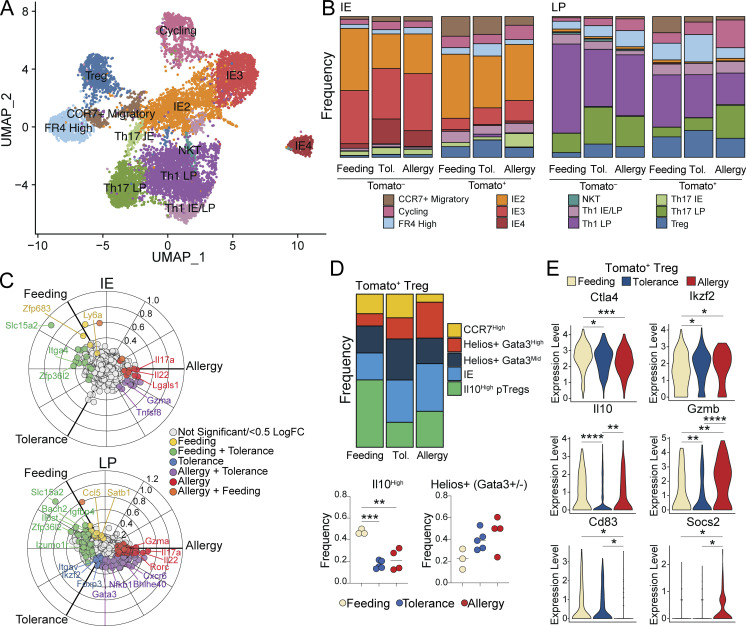
Figure 7.
Distinct intestinal CD4+ T cell responses to OVA feeding, tolerance, and allergy. scRNAseq of 11,217 Tomato+ and Tomato− CD4+ T cells from the IE and LP of mice on day 26 of OVA feeding, tolerance, or allergy protocols using four to five mice per condition pooled across two independent experiments. (A) UMAP visualization of sequenced cells positioned by gene expression similarity and colored by gene expression cluster. (B) Frequency of cells within each cluster from the IE (left) or LP (right) within each sample group. (C) Three-way volcano plots showing differential gene expression between conditions in Tomato+ CD4+ T cells from the IE (top) or LP (bottom). Colored genes are differentially expressed (P-adj < 0.05 from FDR-corrected Kruskal–Wallis Test and log2 fold change > 0.5), colored by the condition(s) in which they are upregulated. Select genes of interest are labeled on each plot. (D) Analysis of Treg subclusters among Tomato+ Tregs (496 total cells) showing frequency of all subclusters (above) or Il10+ or pooled Helios+ subsets (below). (E) Differentially expressed Treg functional genes between Tomato+ Tregs (496 total cells) in different conditions. (D and E) One-way ANOVA with Tukey’s multiple comparison test (D) or Wilcoxon rank sum test corrected with FDR (E), *P < 0.05, **P < 0.01, ***P < 0.001, ****P < 0.0001.

