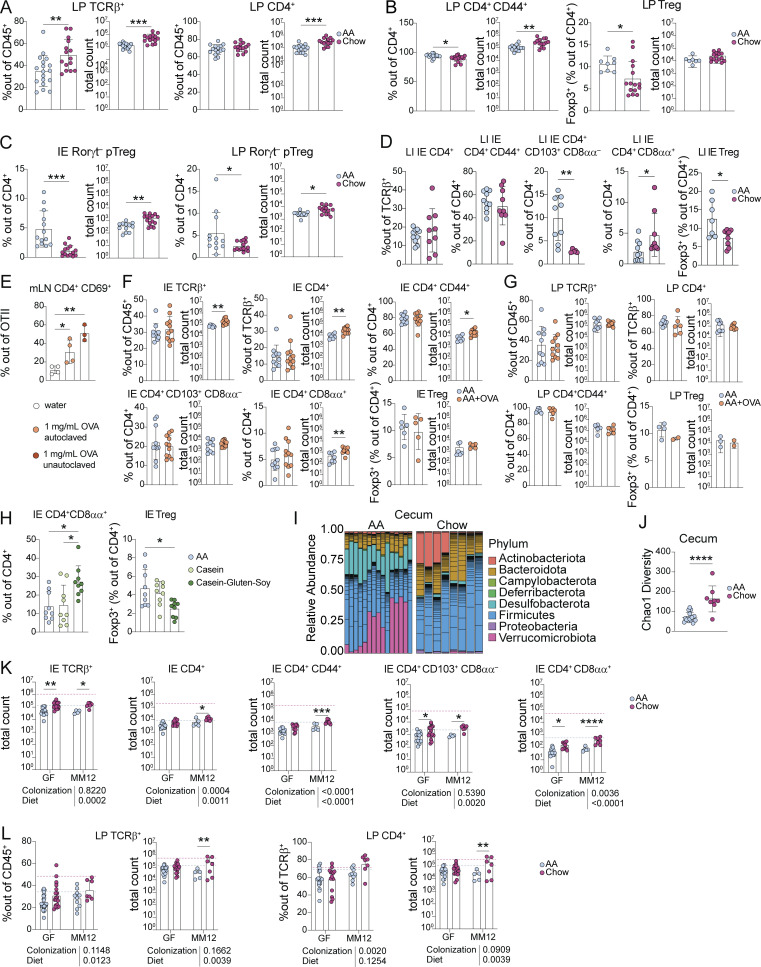
Figure S2.
Dietary signals promote accumulation and adaptation of intestinal CD4+ T cells in the small intestine epithelium. Additional data supporting Figs. 1 and 2. (A–D) Flow cytometry from the small intestine (A–C) or large intestine (D) IE or LP of 8-wk-old SPF mice weaned onto AA or standard chow diet measuring frequency or absolute count of the indicated cell subsets. Mean ± SD representative of three to five independent experiments using 7–18 mice per group. (E) Flow cytometry of transferred OTII CD4+ T cells from the mesenteric lymph nodes (mLN) after 48 h of OVA supplied 1 mg/ml in drinking water as indicated. Data is representative of two independent experiments with three to four mice per group. (F–H) Flow cytometry from the small intestine IE or LP of 8-wk-old SPF mice weaned onto AA diet with or without 1 mg/ml OVA supplied in drinking water (F–G) or AA, casein, or casein–gluten–soy diet (H) measuring frequency or absolute count of the indicated cell subsets. Mean + SD representative of two to three independent experiments using 3–11 mice per group. (I and J) 16S rRNA sequencing of cecum contents of 8-wk-old SPF mice fed AA or standard chow diet represented by relative phyla abundance (I), and SI Chao1 alpha diversity with mean ± SD (J). Data are from four independent experiments using 11–15 mice per condition. (K and L) Flow cytometry from the IE or LP of 8-wk-old GF or Oligo-MM12 mice weaned onto AA or standard chow diet measuring frequency or absolute count of the indicated cell subsets. Dashed lines show mean value from SPF Chow (red) or SPF AA (blue). Bar plots show mean + SD representative of two to three independent experiments using 6–12 mice per group. (A–L) Unpaired t tests (A–D, F, G, and J) or one-way ANOVA with Tukey’s multiple comparison test (E–H), or two-way ANOVA with P values beneath each plot and Holm-Šidák multiple comparison test between diets within each colonization within each plot (K–L), *P < 0.05, **P < 0.01, ***P < 0.001, ****P < 0.0001.

