
Figure 9.
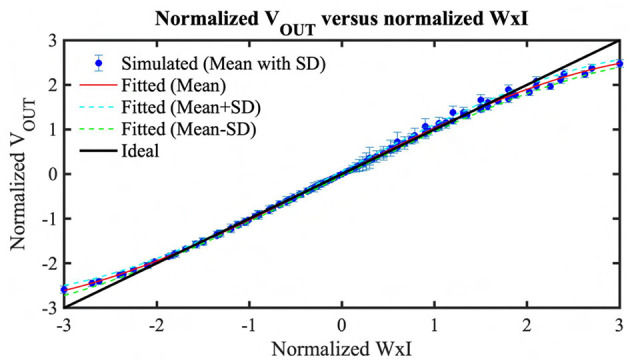
A scatter plot with standard deviation comparing the pixel output voltage to ideal multiplication value of Weights × Input activation (Normalized W × I).
Official websites use .gov
A
.gov website belongs to an official
government organization in the United States.
Secure .gov websites use HTTPS
A lock (
) or https:// means you've safely
connected to the .gov website. Share sensitive
information only on official, secure websites.
A scatter plot with standard deviation comparing the pixel output voltage to ideal multiplication value of Weights × Input activation (Normalized W × I).