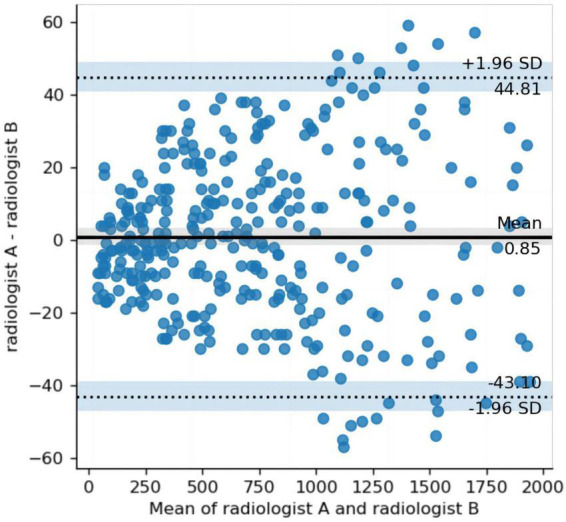
FIGURE 1.

Bland–Altman plot comparing the differences in the volumes annotated by the two radiologists. The y-axis represents the difference (between radiologist A and radiologist B volumes), and the x-axis, the mean of radiologist A and radiologist B. Middle solid line and flanking dashed lines = means ± 1.96 standard deviation, respectively.
