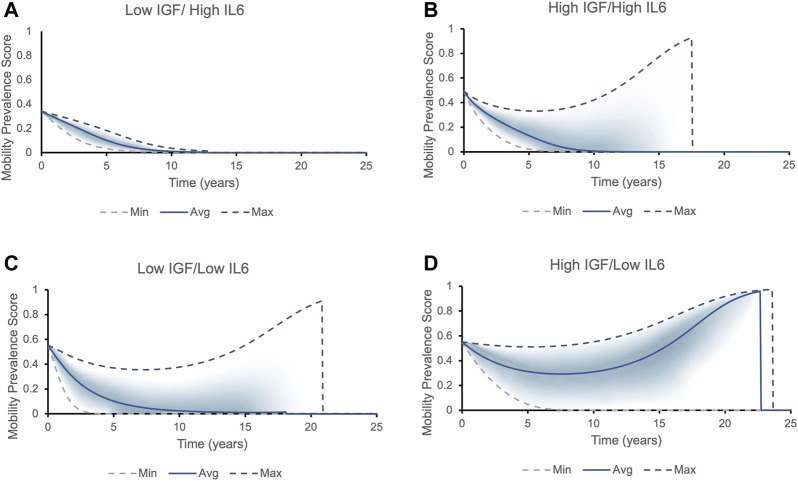
FIGURE 5.
The mobility prevalence score over time for individuals with different initial levels of IGF1 and IL6. Top and bottom lines correspond to the best (highest IGF-1 and lowest IL-6 levels) and worst (lowest IGF-1 and highest IL-6 levels) phenotypic outcomes possible within that each cohort, respectively. The solid line corresponds to the average values of IGF-1 and IL-6 within each cohort. The prevalence score of remaining mobile for each cohort falls into the area between the two dashed lines, with most individuals falling into the shaded area. Two possible outcomes present themselves in all cohorts except for Low IGF/High IL6: either the longer an individual lives, the higher is the prevalence score of remain and die being non-frail/mobile (the prevalence score increases to one and then suddenly drops to zero, indicating a death of an individual - mobile phenotype), or the chances of being mobile rapidly decrease (frail phenotype/declines in mobility). (A) All individuals with initial levels of low IGF-1 and high IL-6 belong to the frailty disability phenotype: the prevalence score of being mobile decreases rapidly. (B) Individuals with initial levels of high IGF-1 and high IL-6 can fall into both phenotypes. The individual’s mobility prevalence score decreases initially, but then start increasing: the longer person lives, the higher their chances to remain and die being mobile. The average individual has roughly 30% chances of dying in a mobile state. (C) Majority of individuals with initial levels of low IGF-1 and low IL-6 express frailty phenotype. (D) Majority of individuals with initial levels of high IGF-1 and low IL-6 case belong to non-frail phenotype.

