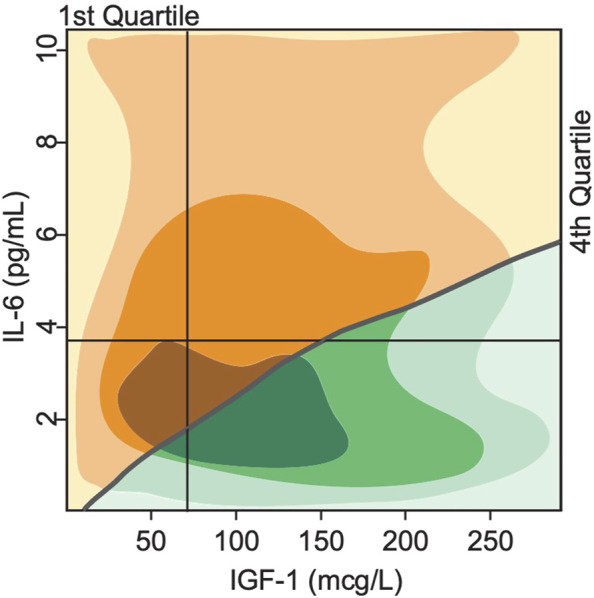
FIGURE 7.

Bistability in biomarkers defines two distinct phenotypes based on deterministically computed mobility disability outcomes. Superimposing the switch points produced by the mathematical model over the experimental study population of Cappola et al., 2003 illustrates a critical threshold (grey line) that divides the population into 2 groups. In the first group (green), the steady state serum level of IGF-1 is high, while IL-6 levels are low, indicating more positive phenotypic outcomes such as lower prevalence score of frailty and declines in mobility performance throughout the lifespan of the group. In the second group (yellow), the steady state serum level of IGF-1 is low, while IL-6 is high, indicating more negative phenotypic outcomes such as higher prevalence score of frailty and declines in mobility performance throughout the lifespan of the group. The shading indicates areas with majority of study population (the darker—the more subjects).
