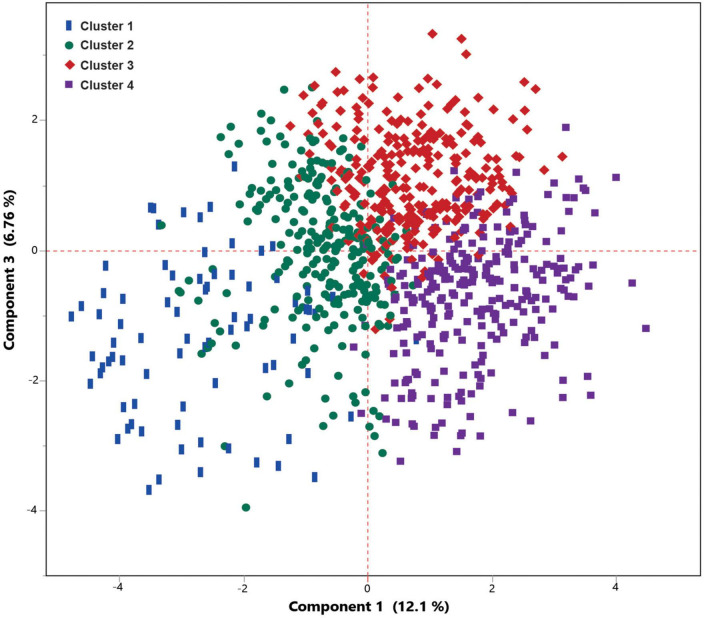
FIGURE 5.
Principal component analysis (PCA) scatter plot shows a very good separation between four clusters obtained from Latent class analysis (LCA) analysis. Cluster 1 and 2 included the patients with a lower mortality risk, while clusters 3 included moderate risk of mortality, and cluster 4 included patients with higher mortality.

