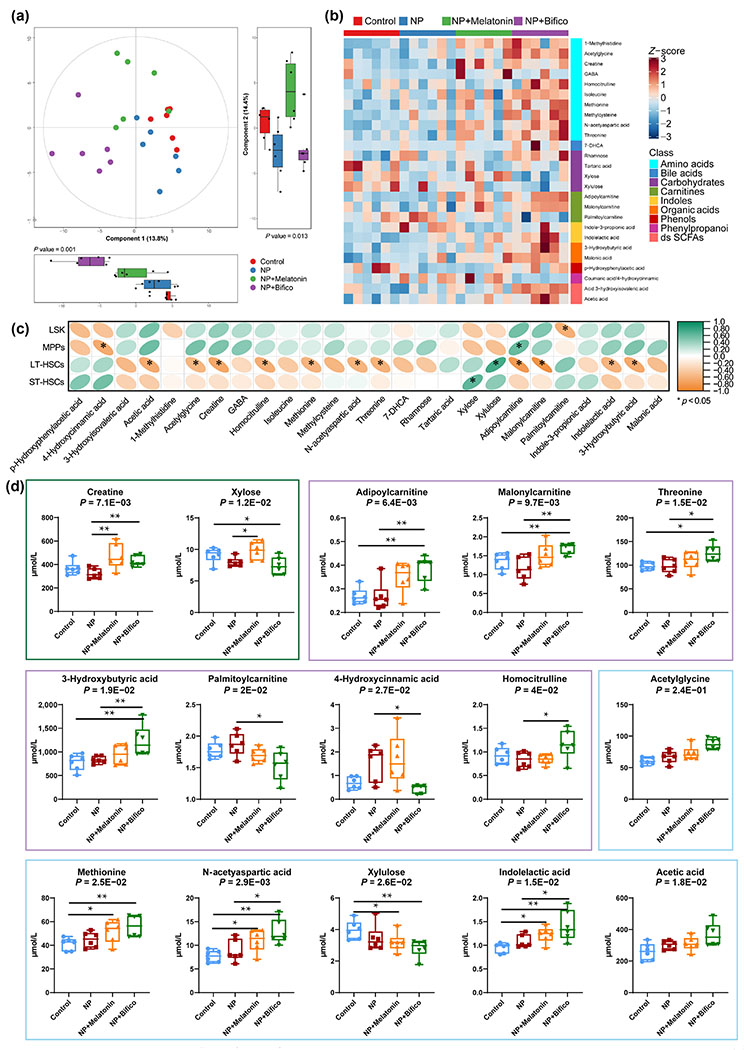
Figure 4.

Melatonin or probiotics treatment alleviated metabolic phenotypes in NP exposure mice (n = 6). (a) Principal component analysis (PCA) score plot with principal component boxplot. (b) 25 identified differential plasma metabolite levels. (c) Correlation between differential metabolite and hematopoietic damage by Spearman analysis. (d) The levels of differential metabolites associated with hematopoiesis. Green boxes indicate metabolites reversed by melatonin, purple boxes indicate metabolites reversed by probiotics, and blue boxes indicate metabolites with no reversal by melatonin or probiotics. Values were presented as median ± quartile. Differences were assessed by Mann Whitney test or Kruskal–Wallis test and denoted as follows: *p < 0.05, **p < 0.01, ns: p > 0.05.
