
Figure 1: Pdm3 instructs complete switches of neuronal fates.
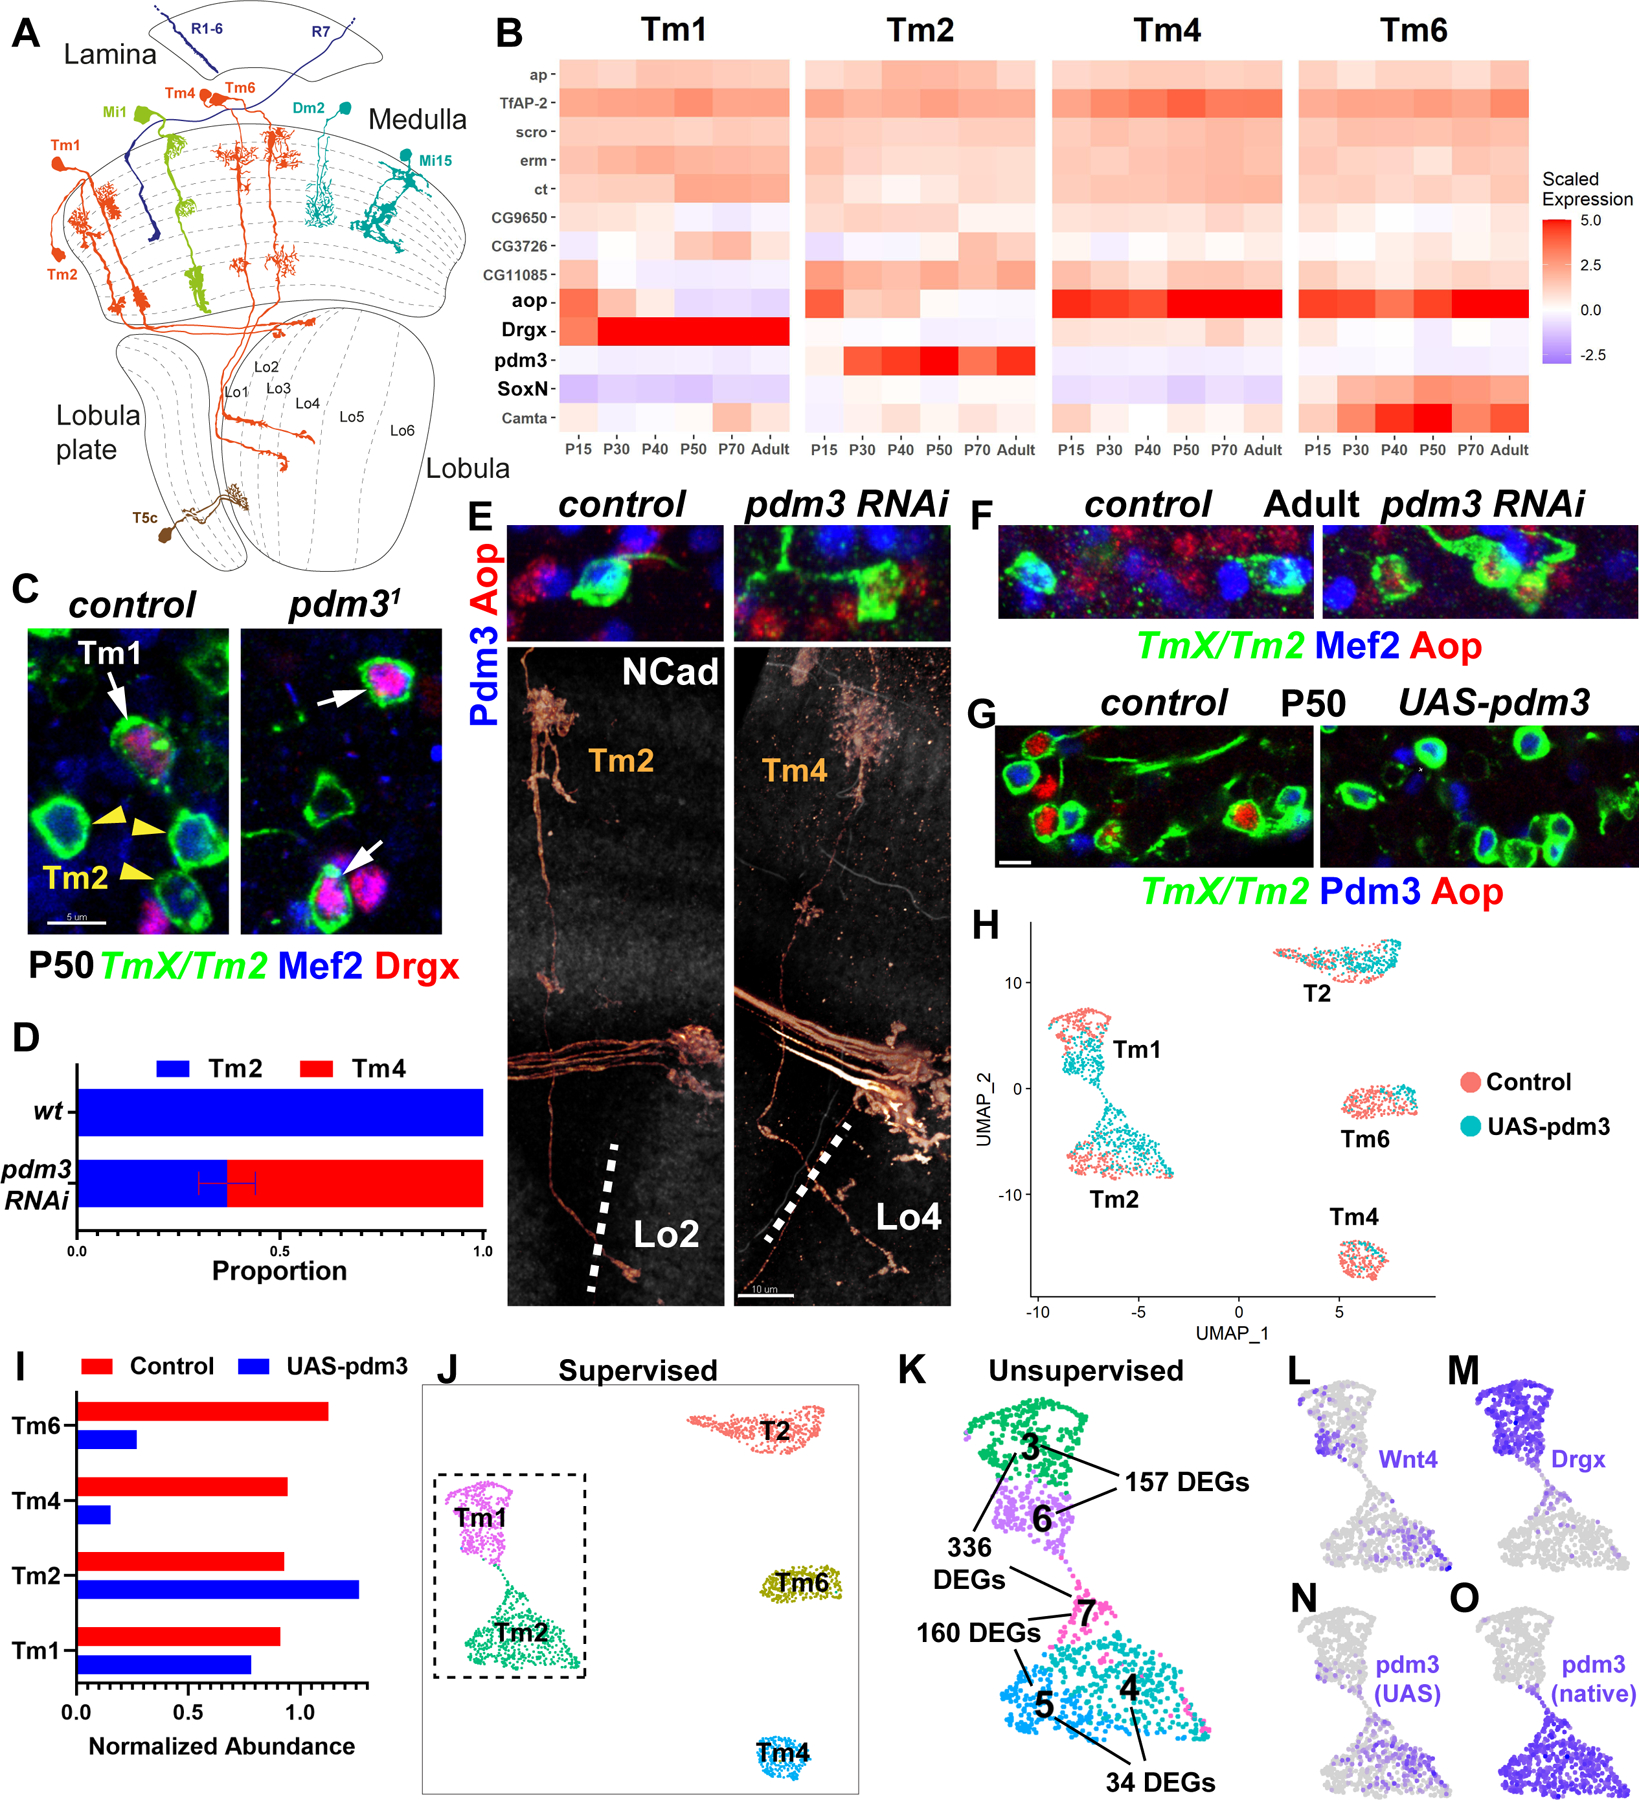
A, D. melanogaster optic lobe in cross-section, with drawings of select cell types. Partially adapted from (2). B, Developmental (scaled) expression patterns (1) of all genes that are candidate selectors in any of the displayed cell types. C, FRT40A and pdm31 MARCM clones labeled with TmX/Tm2-Gal4 and CD4-tdGFP in P50 brains (maximum projection), with anti-Mef2 (blue) and anti-Drgx (red). n= 8 (control) and 4 (mutant) brains. D-F, TmX/Tm2-Gal4 driving pdm3 RNAi and CD4-tdGFP (flip-out). D, Quantification of E-F. n= 54/6 (control), 96/8 (RNAi) neurons/brains, p<0.0001. Error bar denotes SEM. E, 3D reconstructions of GFP (bottom) or max projections (top) for the same representative adult neurons in each condition, with anti-NCad (white), anti-Pdm3 (blue) and anti-Aop (red). The dashed lines indicate the border of the lobula neuropil based on NCad staining. F, Same as (E, top) with anti-Mef2 instead of Pdm3. G, TmX/Tm2-Gal4 driving UAS-pdm3 and CD4-tdGFP (flip-out). Max. projections of somas in P50 medulla cortex, with anti-Pdm3 (blue) and anti-Aop (red). n=129 (control), 118 (pdm3) neurons. Scale bars: 5 μm (C, E-top, F, G) and 10 μm (E-bottom). H-O, scRNA-seq of FACSed neurons, same experiment as (G). UMAP visualizations were calculated using top 6 principal components. Cells are colored according to library (condition) of origin (H), supervised classifications (J), unsupervised clustering (K, inset only, see also Fig. S4A, DEGs: differentially expressed genes) and the log-normalized expression of indicated genes (L-O). I, Numbers of Tm neurons in each library, divided by the number of T2 neurons.