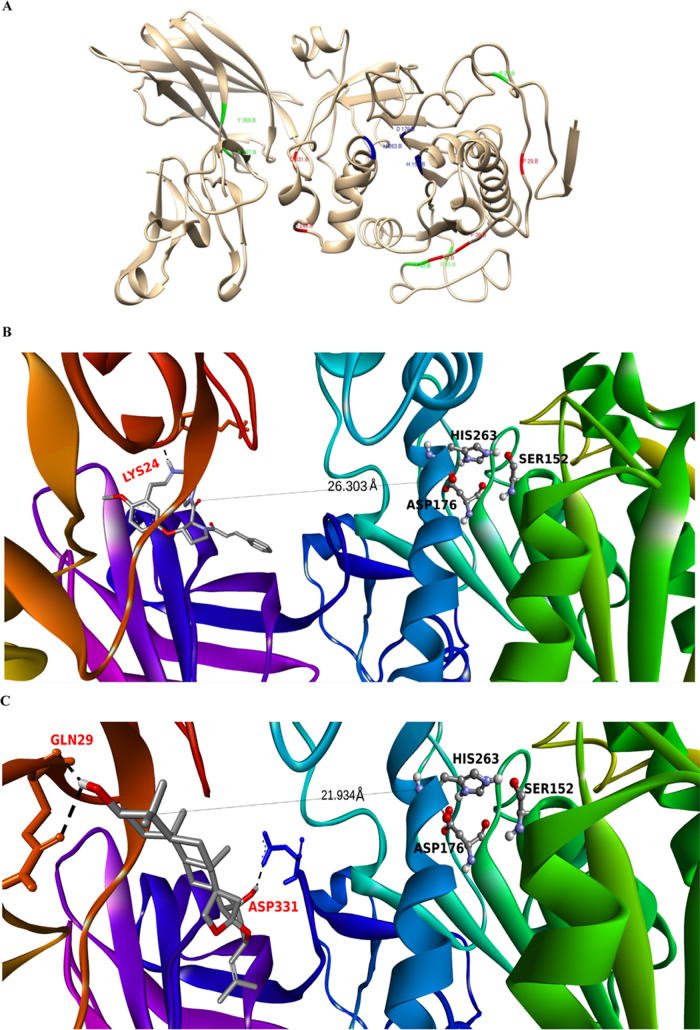
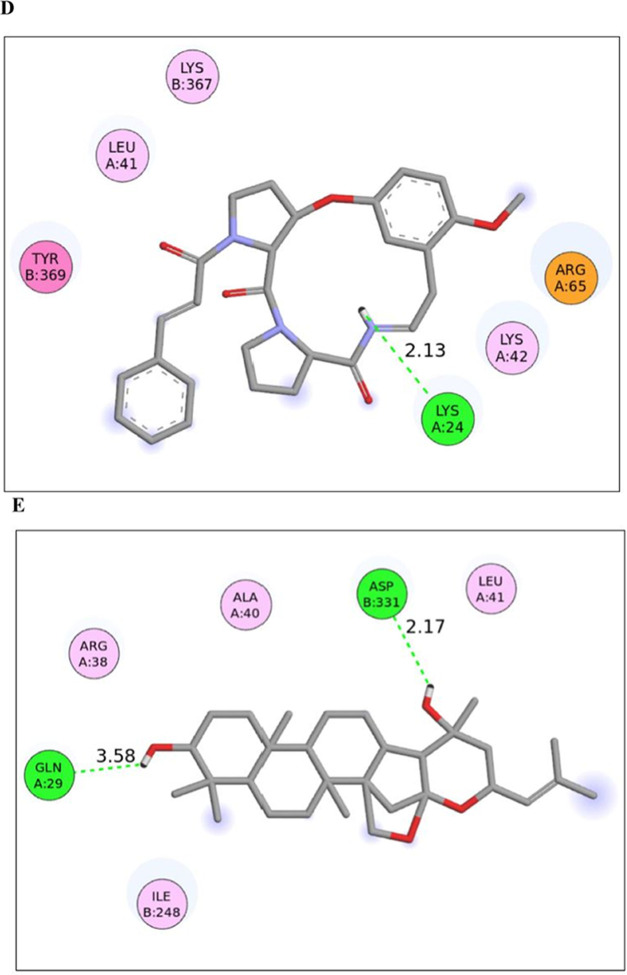
Figure 4.
(A) Three-dimensional (3D) representation of the pancreatic lipase–colipase complex (PDB ID: 1LPB) where the blue region encompasses the catalytic triad. (B) and (C) Three-dimensional images of the two top-ranked molecules (represented in a stick/framework model) 132582306 and 15515703 that are bound at a site different and distant (allosteric) from the catalytic triad comprising serine-152, aspartate-176, and histidine-263. There is a slight variation in the distance (in Å) between the two ligands and the catalytic triad, where the distance between the 132582306-catalytic triad is found to be 26.303 Å, while the 15515703-catalytic triad is found to be 21.934 Å. (D) and (E) Two-dimensional interaction maps illustrating the crucial atomic contacts between the top-ranked molecules (132582306 and 15515703) and the protein residues. The colored broken lines represent the conventional hydrogen-bonding interactions.


