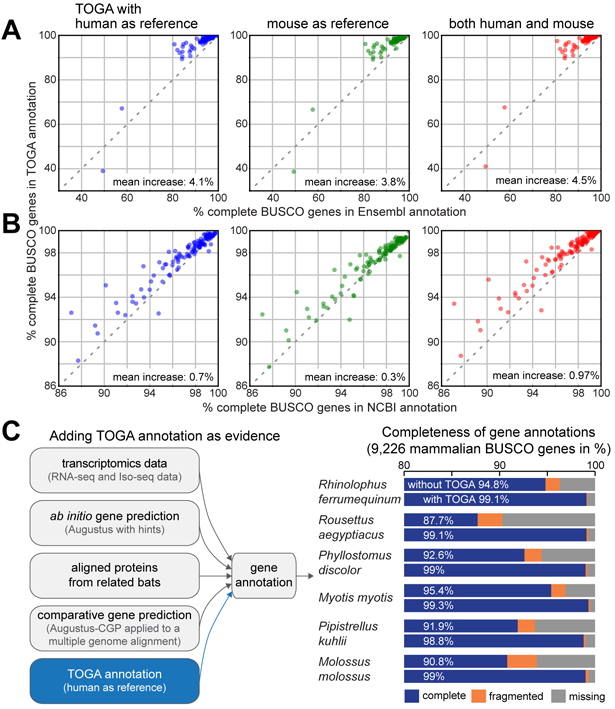
Fig. 3: TOGA improves annotation of conserved genes.

(A,B) Completeness of mammalian BUSCO genes in annotations generated by TOGA (Y-axis), Ensembl (X-axis in A) and the NCBI Eukaryotic Genome Annotation Pipeline (X-axis in B). Each dot represents one species. The set of 70 and 118 species in A and B overlaps but is not identical.
(C) Gene evidence used to annotate six bat species. Adding TOGA as evidence increases annotation completeness of mammalian BUSCO genes by 3.9% to 11.4%.
