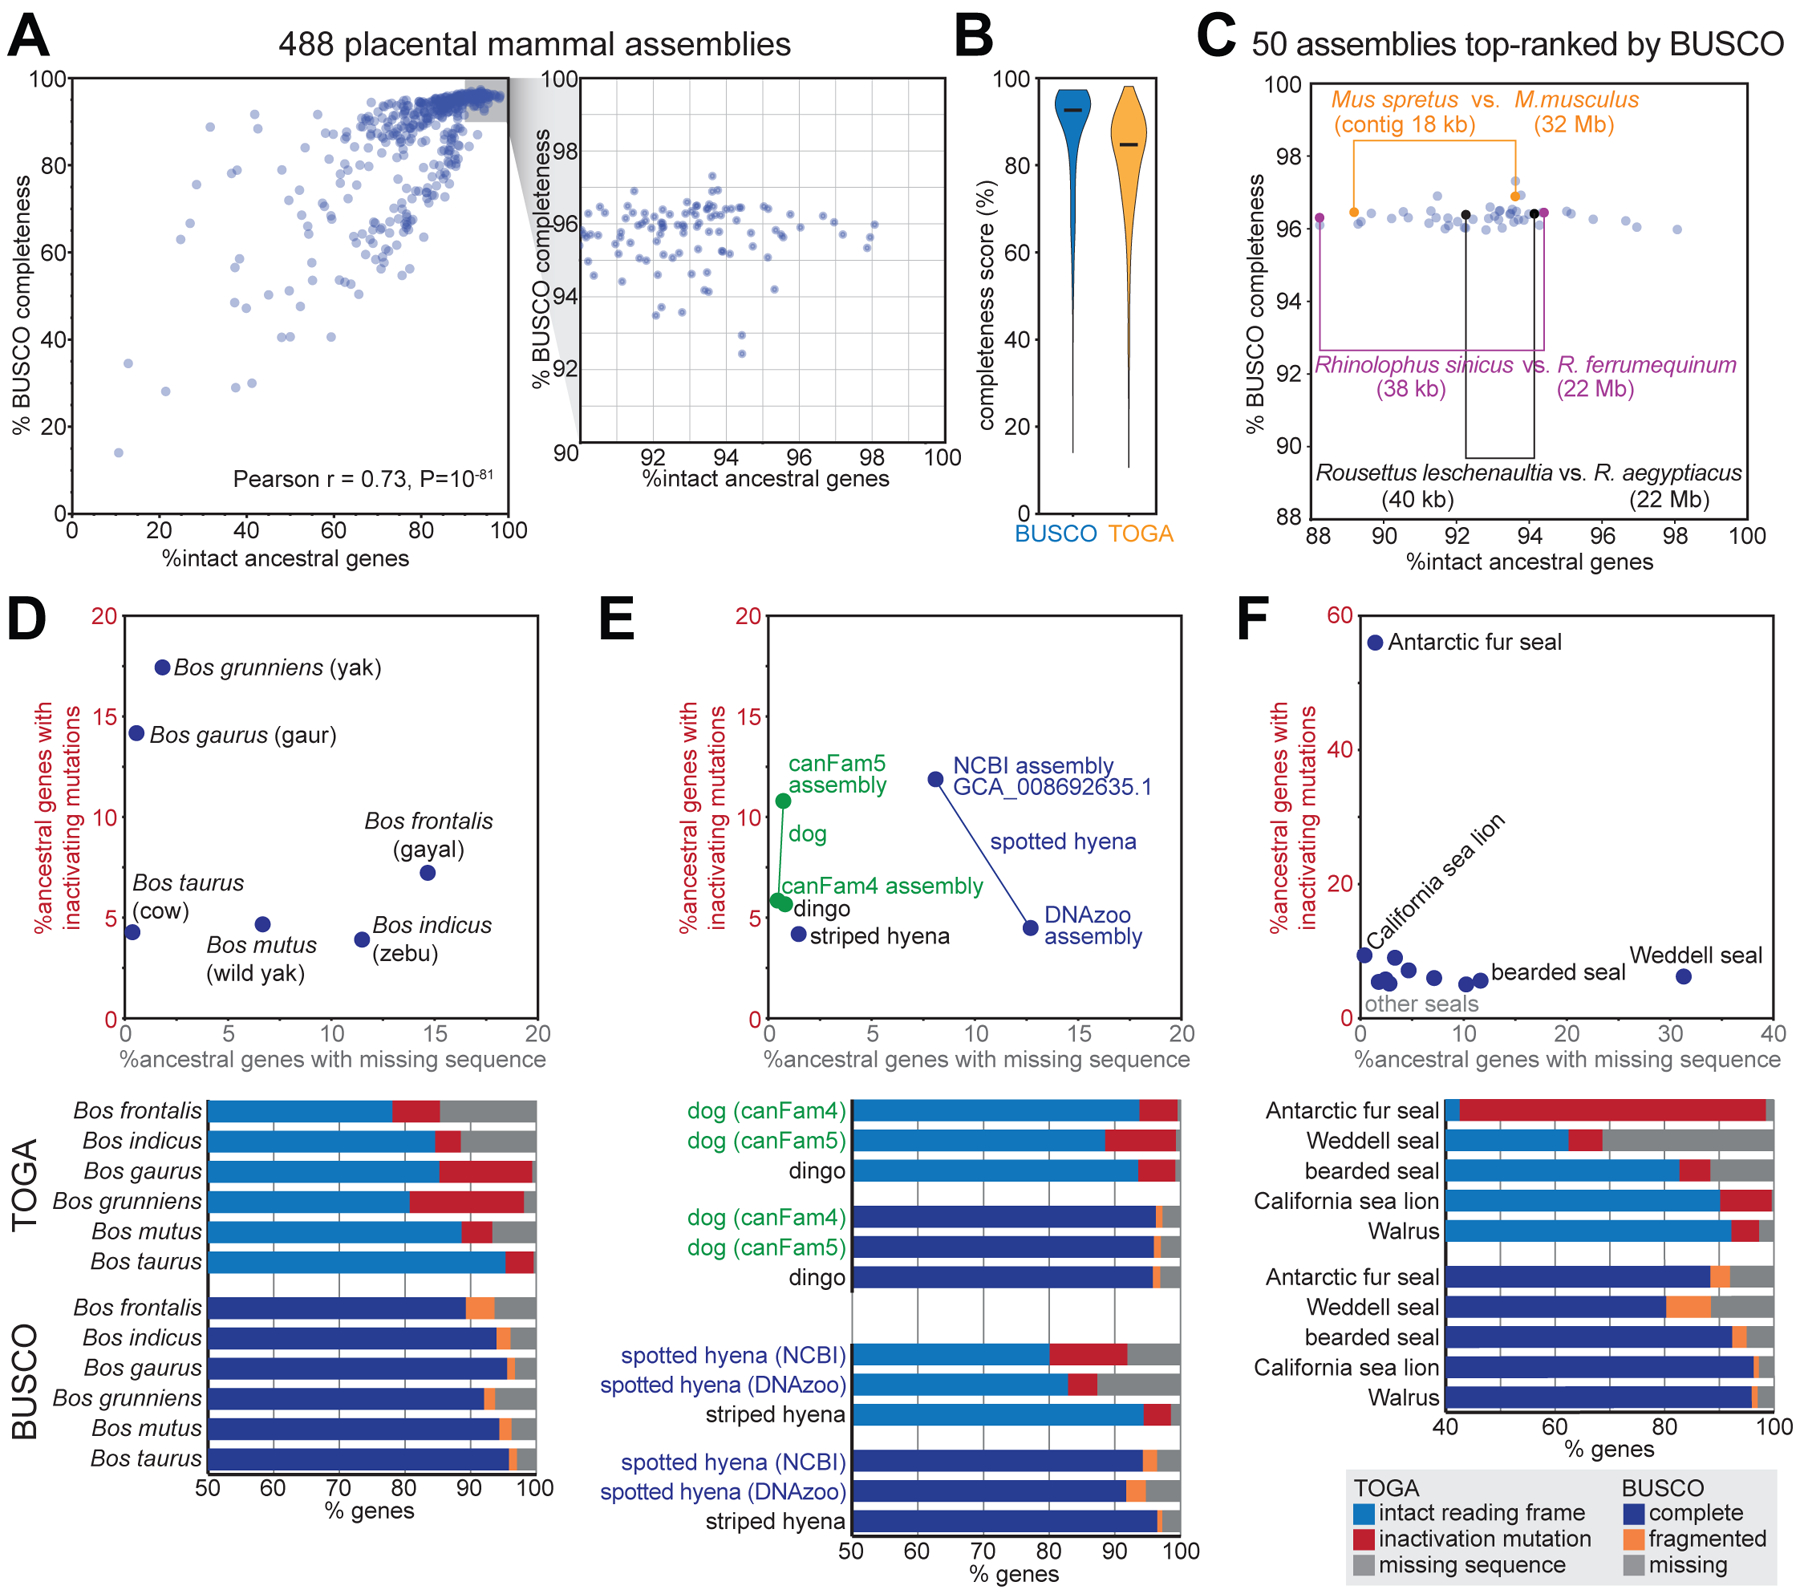
Fig. 6: TOGA provides a superior measure of mammalian assembly quality.

(A) Comparison of the percent complete BUSCO genes and TOGA’s percent intact ancestral genes for 488 placental mammal assemblies. Each dot represents one assembly.
(B) Violin plots of BUSCO’s and TOGA’s completeness values. Horizontal black lines represent the median.
(C) BUSCO’s and TOGA’s completeness values for 50 assemblies that are top-ranked by BUSCO. Three pairs of closely related species are highlighted that have different assembly contiguity (contig N50) values and are distinguishable in terms of gene completeness by TOGA, but not by BUSCO.
(D-F) TOGA distinguishes between genes with missing sequences and genes with inactivating mutations. This highlights assemblies with a higher incompleteness or base error rate that is often not detectable by the BUSCO metrics.
