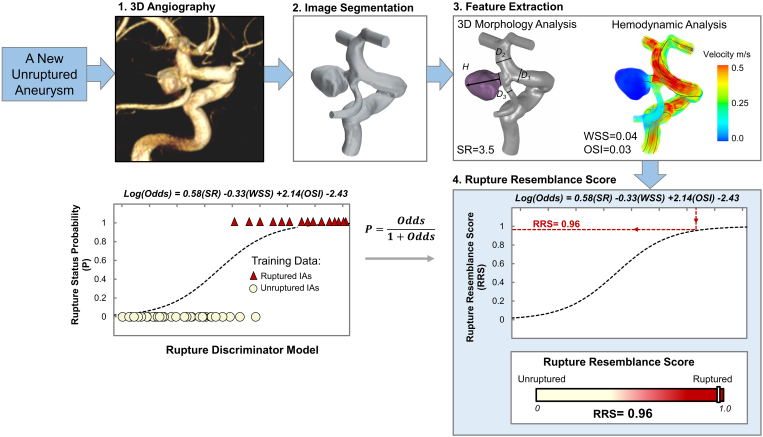
FIG. 1.
Workflow for calculating RRS. 1) 3D angiography; 2) segmentation of images to reconstruct the aneurysm geometry; 3) performing 3D morphology analysis and CFD to extract morphological and hemodynamic features, respectively; and 4) feeding the SR, WSS, and OSI data into the previously developed logistic discriminator model.12 Then, the rupture status probability is reported as RRS. D = vessel diameter; H = height.

