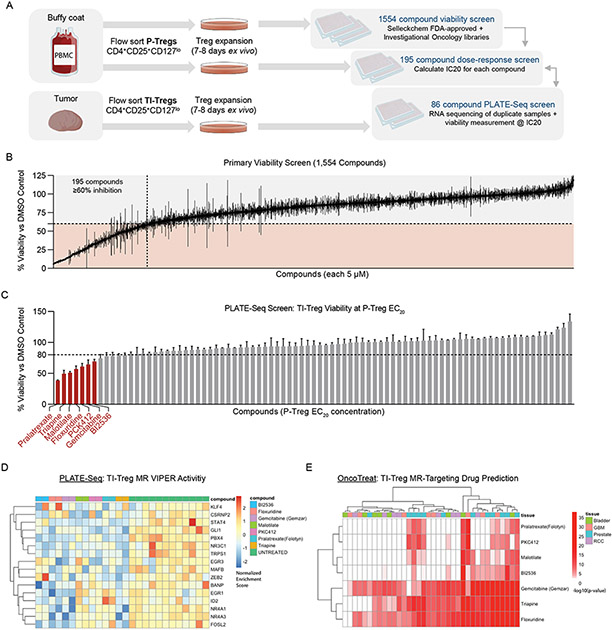
Figure 3: High-Throughput Drug Screening Platform Identifies Potential Drug Candidates with Tumor-Treg-Directed Toxicity:
(A) Experimental design of High-Throughput Treg-Directed Drug Toxicity Screen. (B) Results from initial set of 1,554 FDA-approved and investigational oncology compounds screened at single-dose for peripheral Treg growth inhibition, with 195 compounds showing >60% inhibition at 5μM. (C) Viability results of the PLATE-Seq screen, where human tumor Tregs were assessed for growth inhibition on sorted Tumor Tregs at peripheral-Treg EC20 dose, resulting in 7 drugs with higher toxicity in TI-Tregs relative to P-Tregs. Data shown as % viability for each drug vs. DMSO control (D) Heatmap of VIPER protein activity for Tumor vs Peripheral Treg MRs defined in 1E, 1F comparing transcriptional effect of drugs in (C) vs untreated control, with downregulation of nearly all identified Master Regulators by these drugs. (E) Patient-by-Patient Drug predictions according to inversion of patient Tumor Treg vs Peripheral Treg protein activity signature by drug-treatment protein activity signature. Each drug predicted to invert Tumor Treg signature with - log10(Bonferroni-Corrected p-value) < 0.01 in a particular patient is colored red. Patients are grouped by tumor type. Subset to drugs identified by tumor Treg growth screen in (C), with columns colored by tumor type and clustered by unsupervised hierarchical clustering.
See also Figures S3 and S4.

