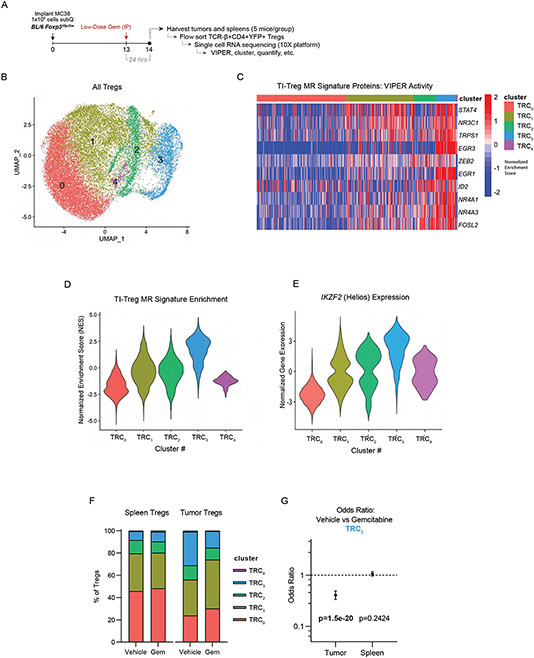
Figure 5: Single-Cell RNA-Sequencing Suggests Low-Dose Gemcitabine Depletes TI-Tregs.
Exhibiting high TI-Treg Master-Regulator Activity: (A) Schematic of experimental workflow. (B) UMAP plot and unsupervised clustering by VIPER-inferred protein activity of Tregs from untreated and gemcitabine-treated tumor and spleen. (C) Heatmap of cell-by-cell protein activity for each Tumor-Treg MR identified by scRNA-seq, grouped by cluster. (D) Distribution of the 17-gene TI-Treg MR signature normalized enrichment score by Gene Set Enrichment Analysis (GSEA), grouped by cluster, such that cluster TRC3 is most enriched for the TI-Treg MR signature. (E) Distribution of IKZF2 (Helios) Normalized Gene Expression, grouped by cluster, such that the cluster TRC3 has highest expression. (F) Barplot of cluster frequencies in each sample, such that cluster TRC3 has a baseline frequency of 7.8% in spleen of vehicle-control sample and 30.1% in tumor (p = 1.78e-84), with frequency of only 14.9% in tumor of gemcitabine-treated sample (p = 1.51e-20). (G) Cox proportional hazard ratios of cluster TRC3 frequencies in vehicle vs gemcitabine treated mice in tumor (OR = 0.407 [95% CI: 0.334-0.494]) and spleen (p = 0.242, OR = 1.063 [95% CI: 0.958-1.17]).
See also Figure S6.

