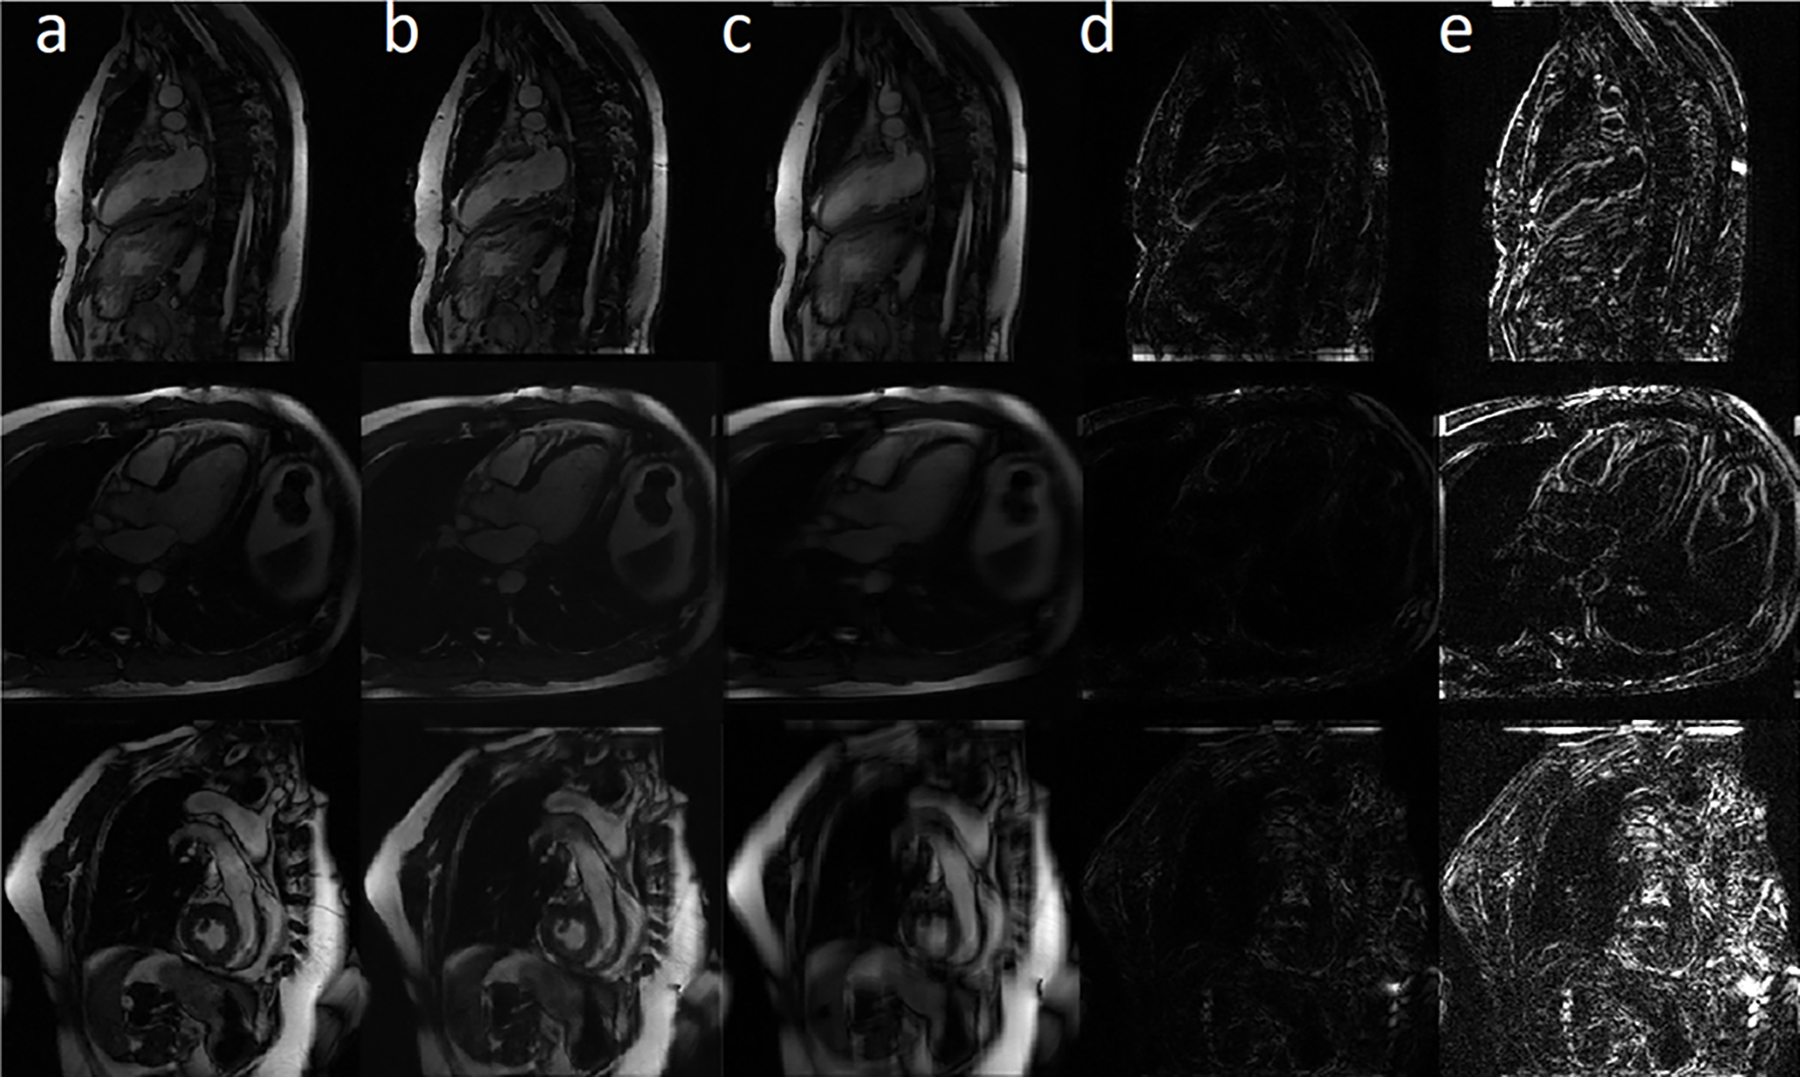
Figure 3.

Motion accuracy simulation study results. Columns a, b, and c are the ground truth, motion-corrected, and synthetically motion-corrupted images. Absolute error map between ground truth and the motion-corrected/motion-corrupted images are shown in columns d and e, respectively. The first row shows an example for the vertical long-axis view, the second row presents a horizontal long-axis view, and the third row represents the short-axis view.
