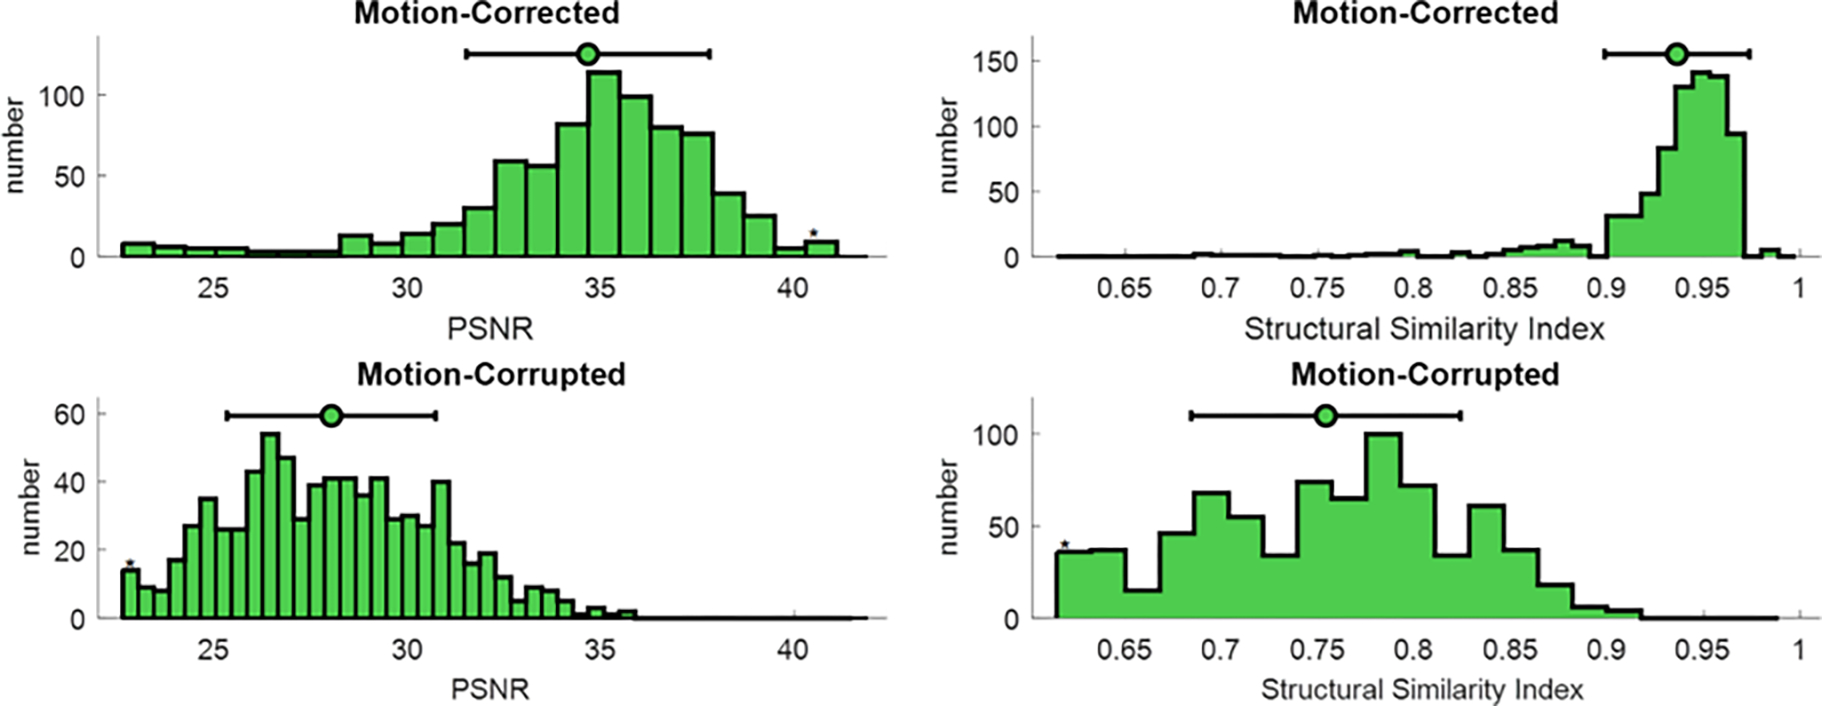
Figure 4.

Quantitative simulation analysis. SSIM and PSNR, common metrics for image evaluation, were calculated for the simulated motion-corrupted data sets (bottom row) and motion-corrected images (top row). Both scores were reported by frequency plot and 95% of confidence interval. Mean values are shown with green circles; 95% of confidence intervals are depicted by black lines.
