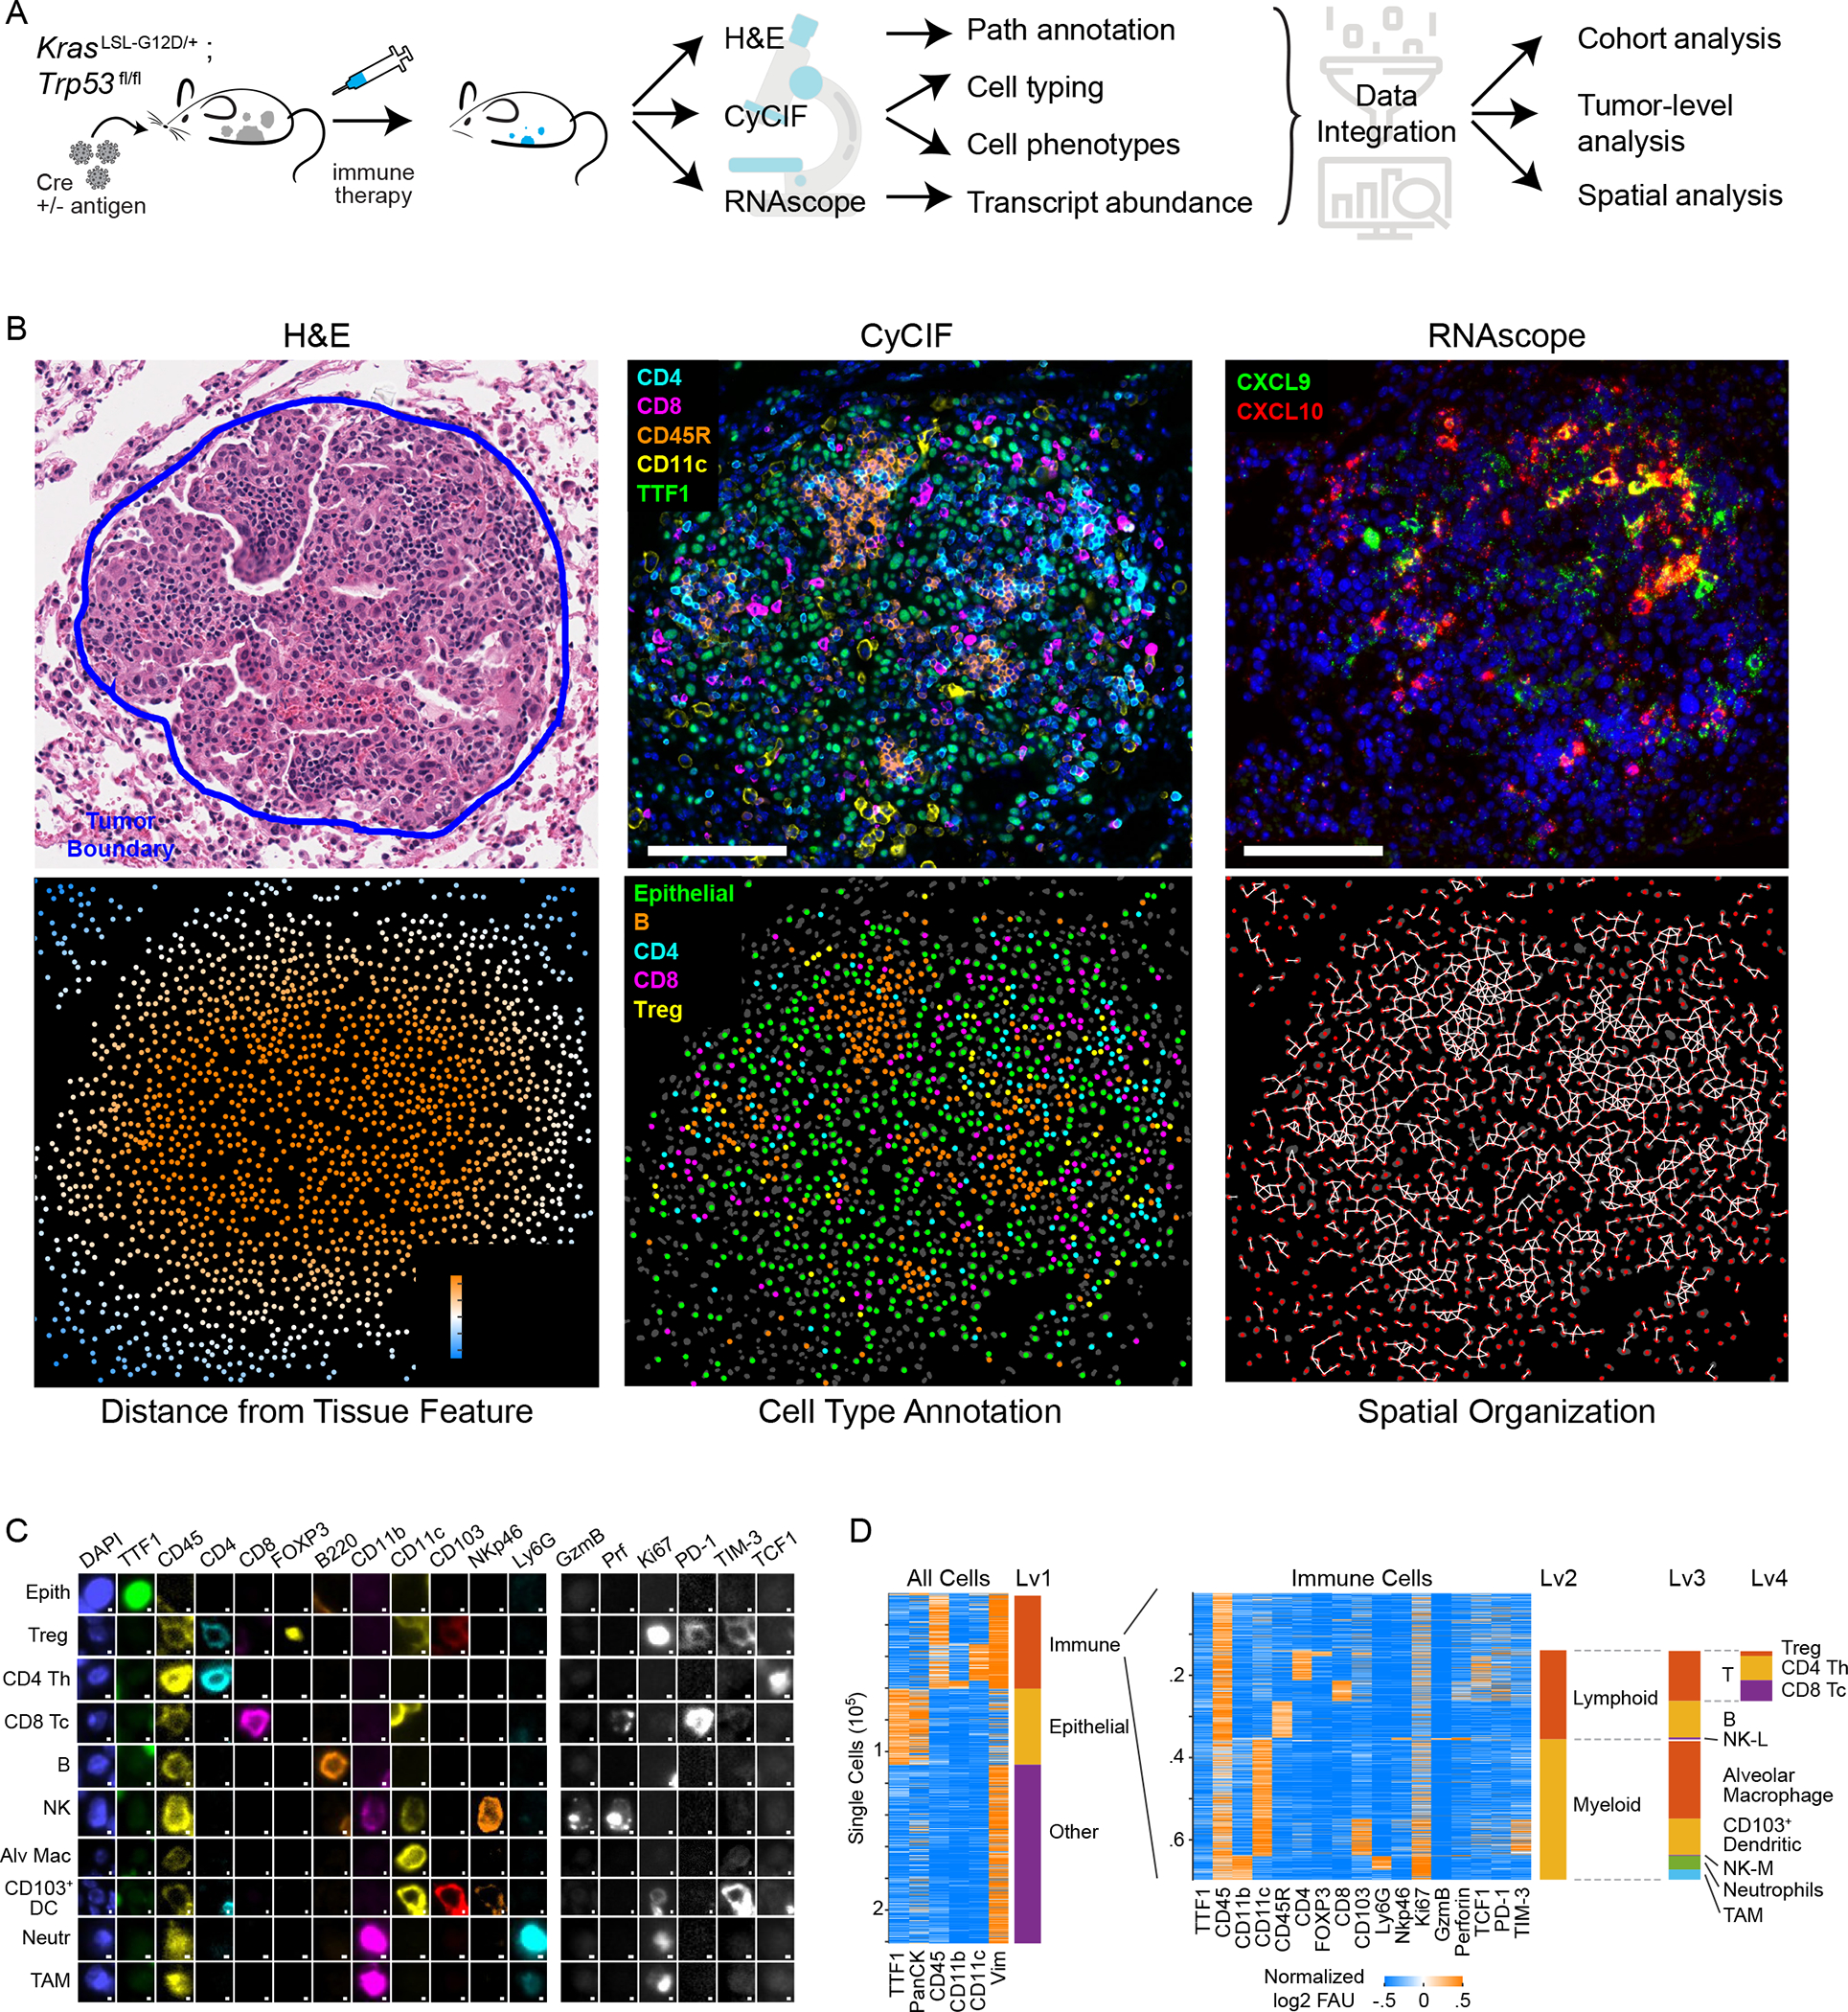
Figure 1. Spatial analysis of KP GEMM tumor-immune microenvironment by multimodal data integration.

(A) Schematic: KP lung cancer GEMM, treatments, and multi-modality data integration. (B) Images acquired from KP-LucOS GEMM tumor nodule (expressing CD8+ T cell antigens): H&E, multiplexed CyCIF image of immune/tumor markers (DNA, blue), Cxcl9, Cxcl10 RNAScope™ (DNA, blue) (serial sections), map showing distance of cells from tumor edge, cell-type annotation map, and ‘graph’ map of physically interacting cells (Delaunay Triangulation). (C) Gallery of lineage, cell-state, and functional markers from CyCIF images of KP LucOS. Scalebar: 1μm. (D) Sequential clustering of CyCIF data using marker combinations in Figure S1C for immune, epithelial/tumor, stromal populations (rows=individual cells). See also Figure S1 and Table S1.
