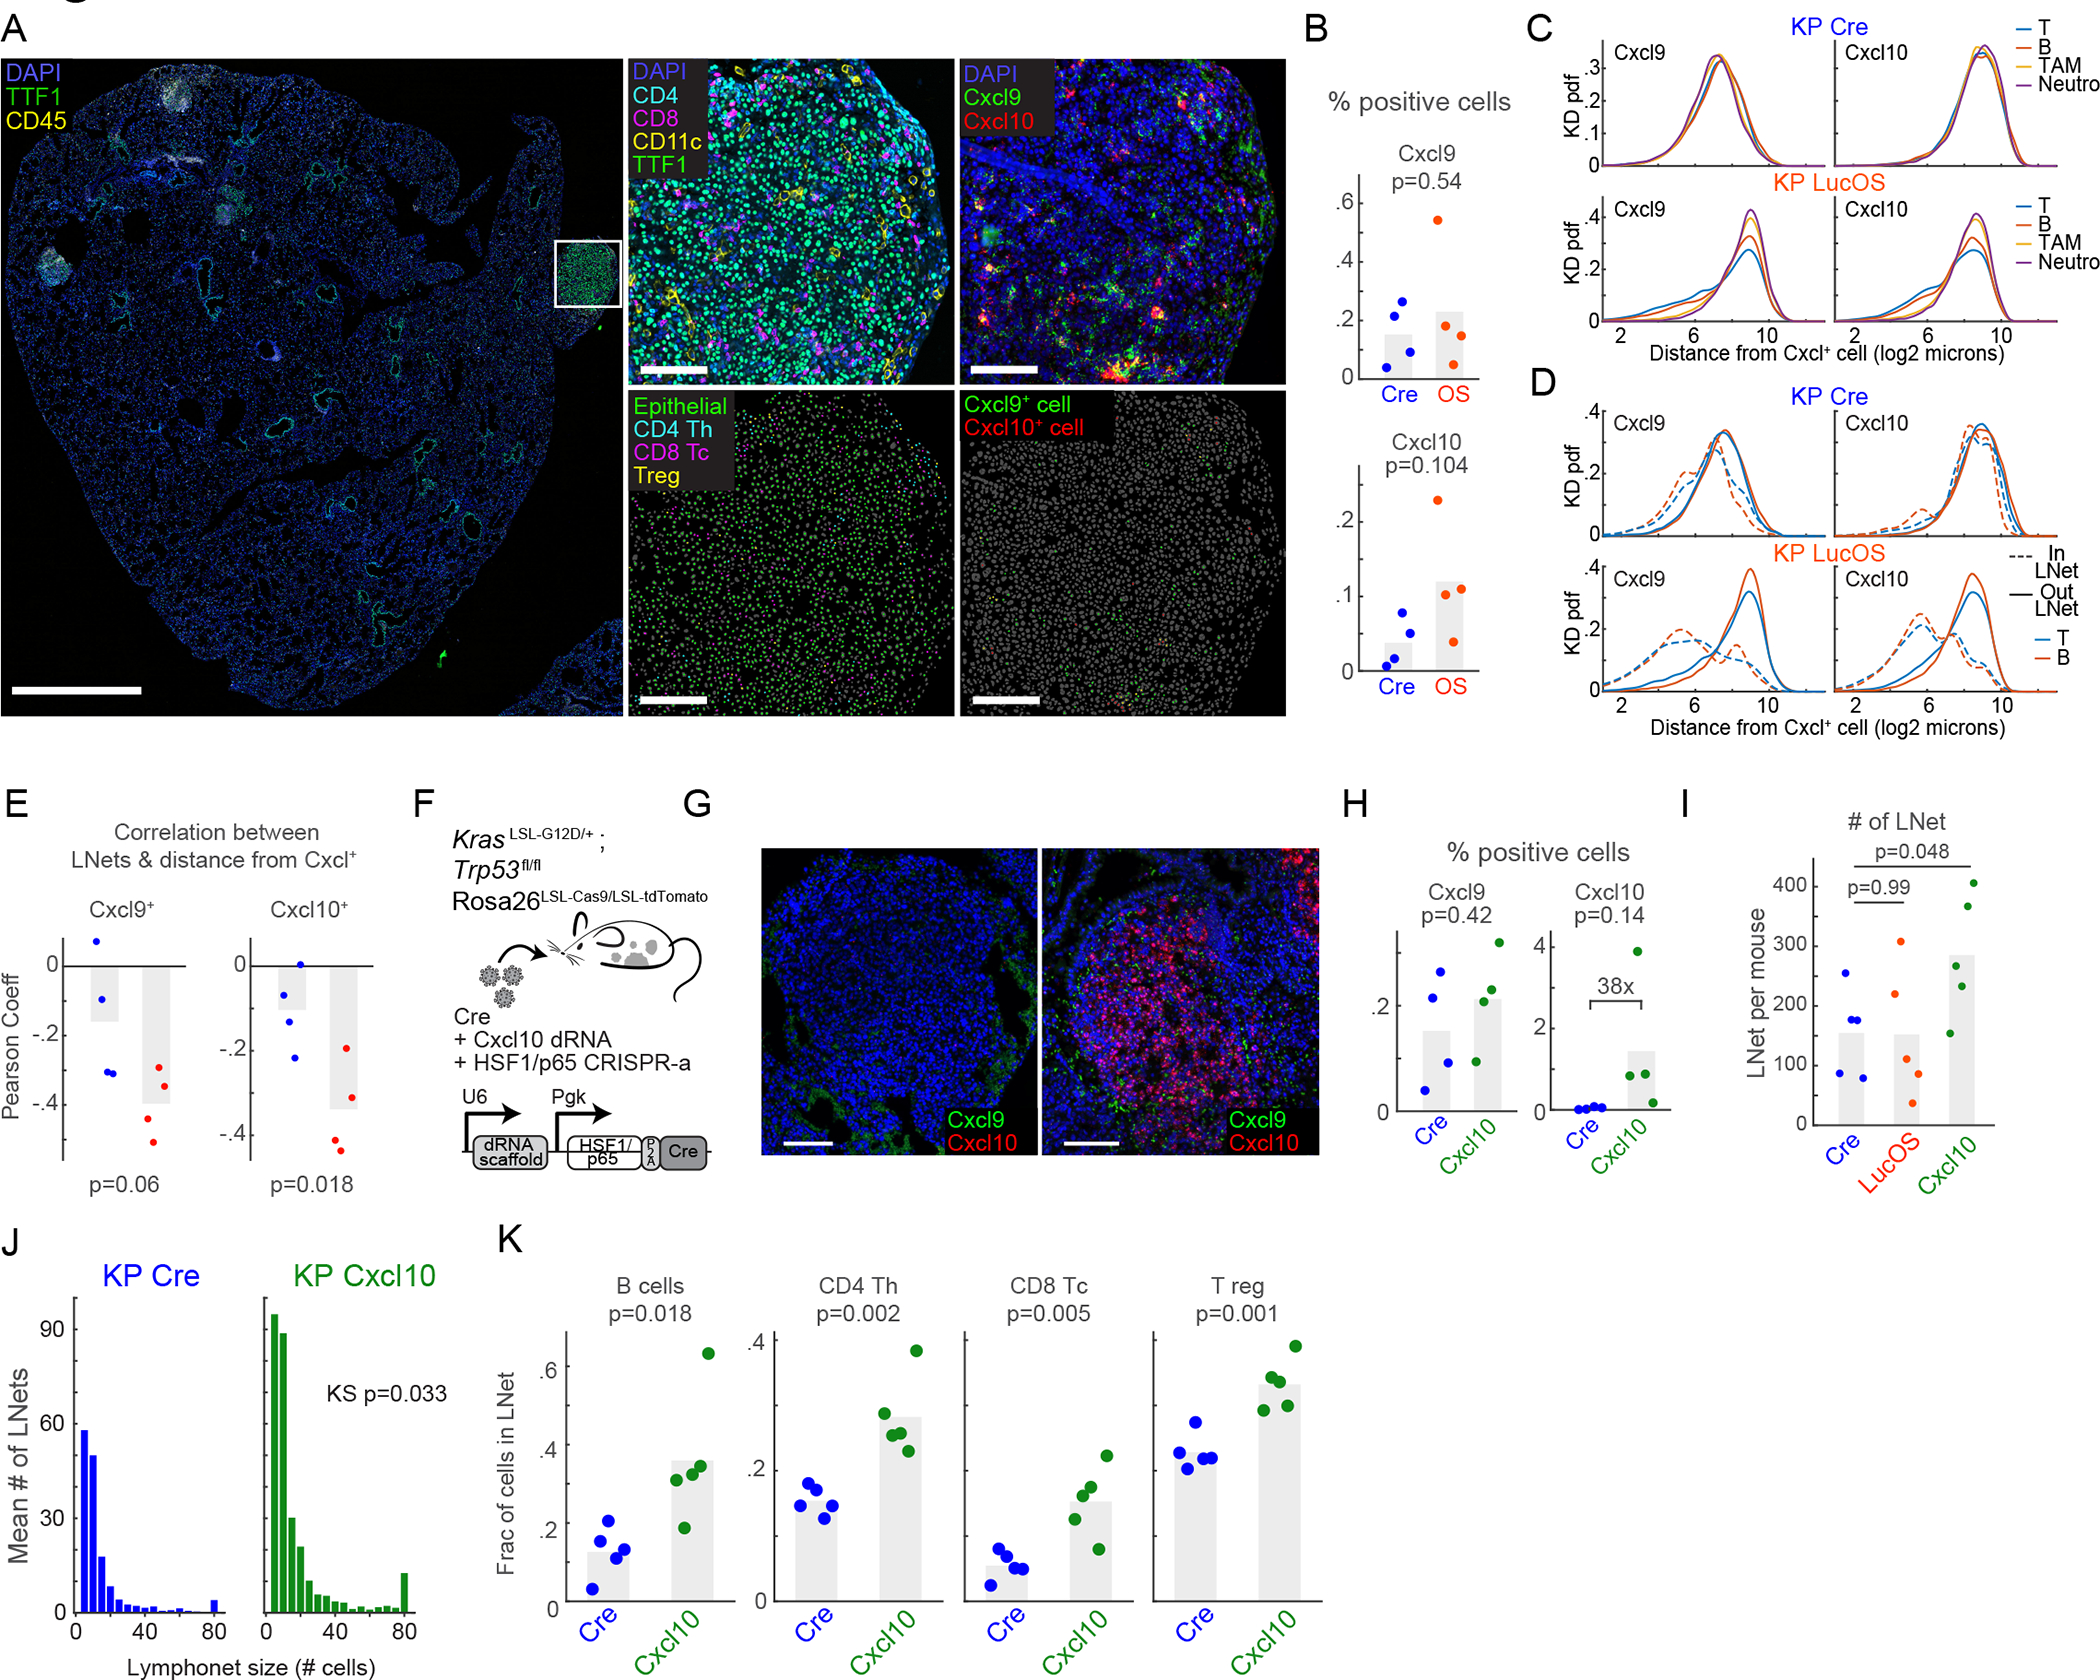
Figure 4. CXCR3 ligands modulate lymphonet formation and size but not intratumoral localization.

(A) CyCIF and RNAScope™ images from LucOS tumor (serial sections); cell type/state calls indicated. (B) %total cells expressing Cxcl9 and Cxcl10 mRNA in Cre- versus LucOS-lung tissue (n=4 mice/group, bar=mean). (C-D) Probability density functions of distance of (C) indicated immune-cell populations or (D) T and B cells in or out of lymphonets from Cxcl9 and Cxcl10 mRNA-expressing cells in Cre and LucOS. (E) Correlation between likelihood of lymphocytes belonging to lymphonets and their distance to the closest Cxcl9 or Cxcl10 mRNA-expressing cells in Cre (blue) and LucOS (red) (n=4 mice/group, bar=mean). (F) Schematic: lentiviral system to deliver dRNAs and HSF1/p65 activation complex for CRISPR-a Cxcl10 in KP Cas9 mice. (G) Images of Cxcl9 and Cxcl10 mRNAs using RNAscope™ in KP-Cre versus KP Cxcl10-activated tumor nodules. (H) %total cells expressing Cxcl9 and Cxcl10 mRNA in KP-Cre versus KP-Cxcl10 (n=4 mice/group, bar=mean). (I) Number of lymphonets/mouse in KP-Cre, KP-LucOS, and KP-Cxcl10 (n=5 mice/group, bar=mean). (J) Histogram of mean number of lymphonets/mouse of indicated size in KP-Cre and KP-Cxcl10 (n=5 mice/group, two-tailed KS test). (K) Plots of fraction of lymphocyte populations within lymphonets in KP-Cre and KP-Cxcl10 (n=5 mice/group, bar=mean,). All p-value are from two-tailed t-test unless specified. See also Figure S4 and Table S2.
