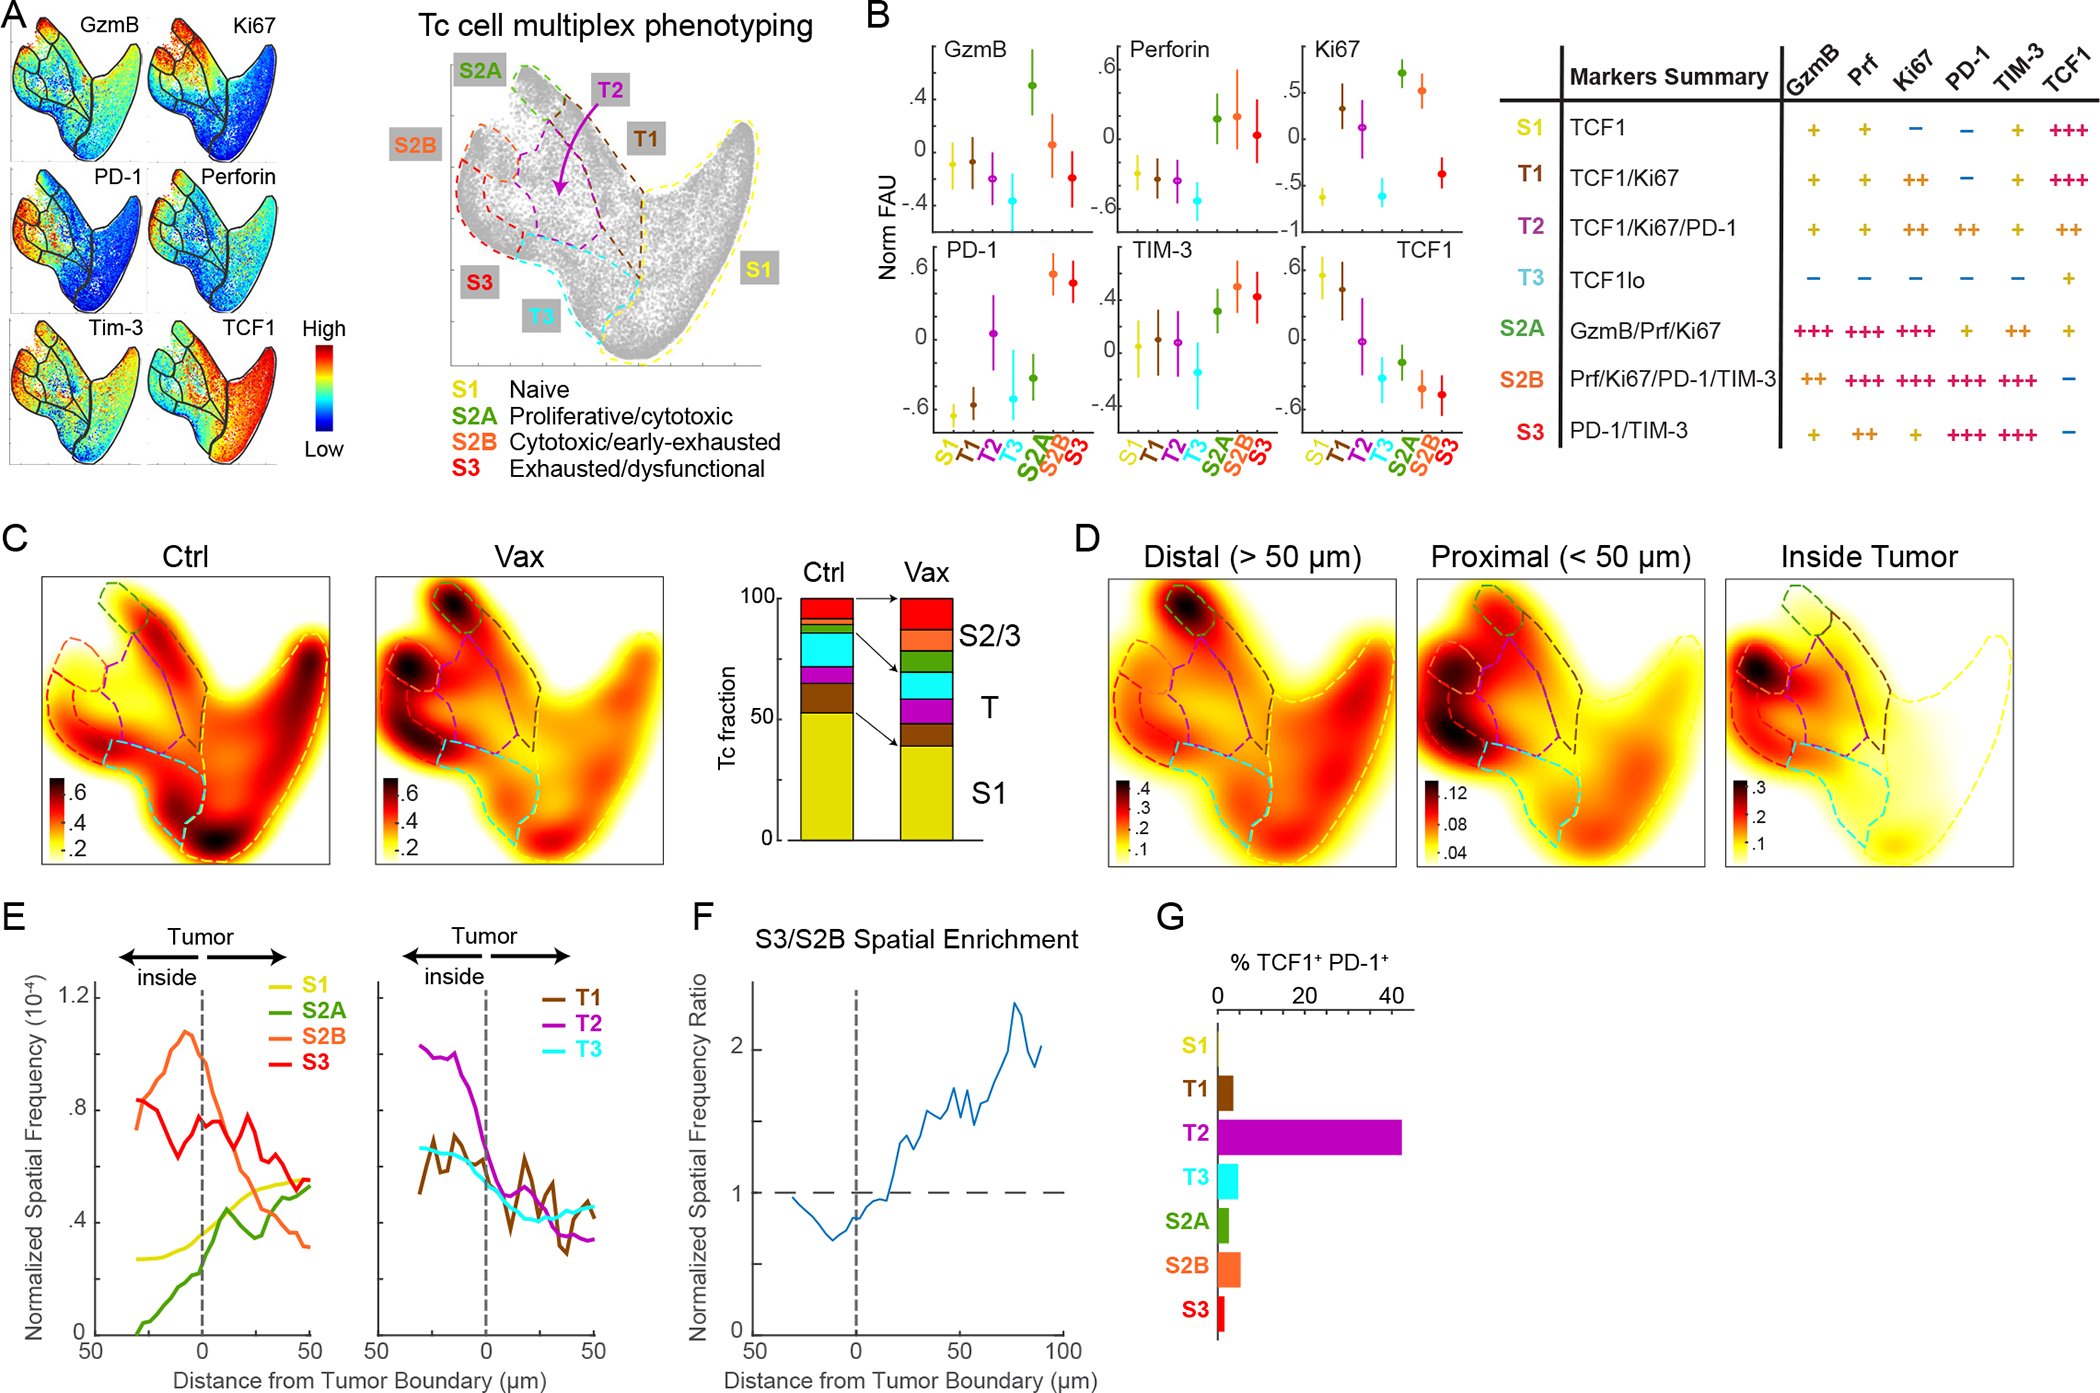
Figure 5. Spatial analysis reveals dynamic shifts in Tc cell states and localization with immunotherapy.

(A) Palantir projection of CD8+ Tc populations in KP-LucOS mice treated with SIINFEKL (SIIN) and SIYRYYGL (SIY) long-peptide vaccine (Vax) or PBS/Ctrl (n=104 cells sampled from n=8 and 7 mice/treatment). Expression levels of indicated markers are color mapped (normalized between 0.1 and 99thpercentile). Tc states (S1, S2A, S2B, S3) defined by multiparameter measurements indicated at extremes of representation, connected by transitional phenotypes (T1-T3); schematic, right. (B) Normalized fluorescence units for markers in indicated Tc cell states and transitions (mean±25th percentile); summary of Tc states and transitions; table, right. (C) Heat map of Tc cell densities in Palantir projections for Ctrl and Vax groups (n=104 cells/treatment). Right, stacked-bar graph of Tc cell fractions in each state and transition. (D) Heat map of Tc densities in Palantir projections for LucOS following Vax by indicated distance from tumor boundary and (E) their spatial frequency from tumor boundary (Vax). (F) Enrichment of S3 versus S2B relative to boundary. (G) %Tc cells that are TCF1+ PD-1+ in Tc cell states/transitions. See also Figure S5 and Table S2.
