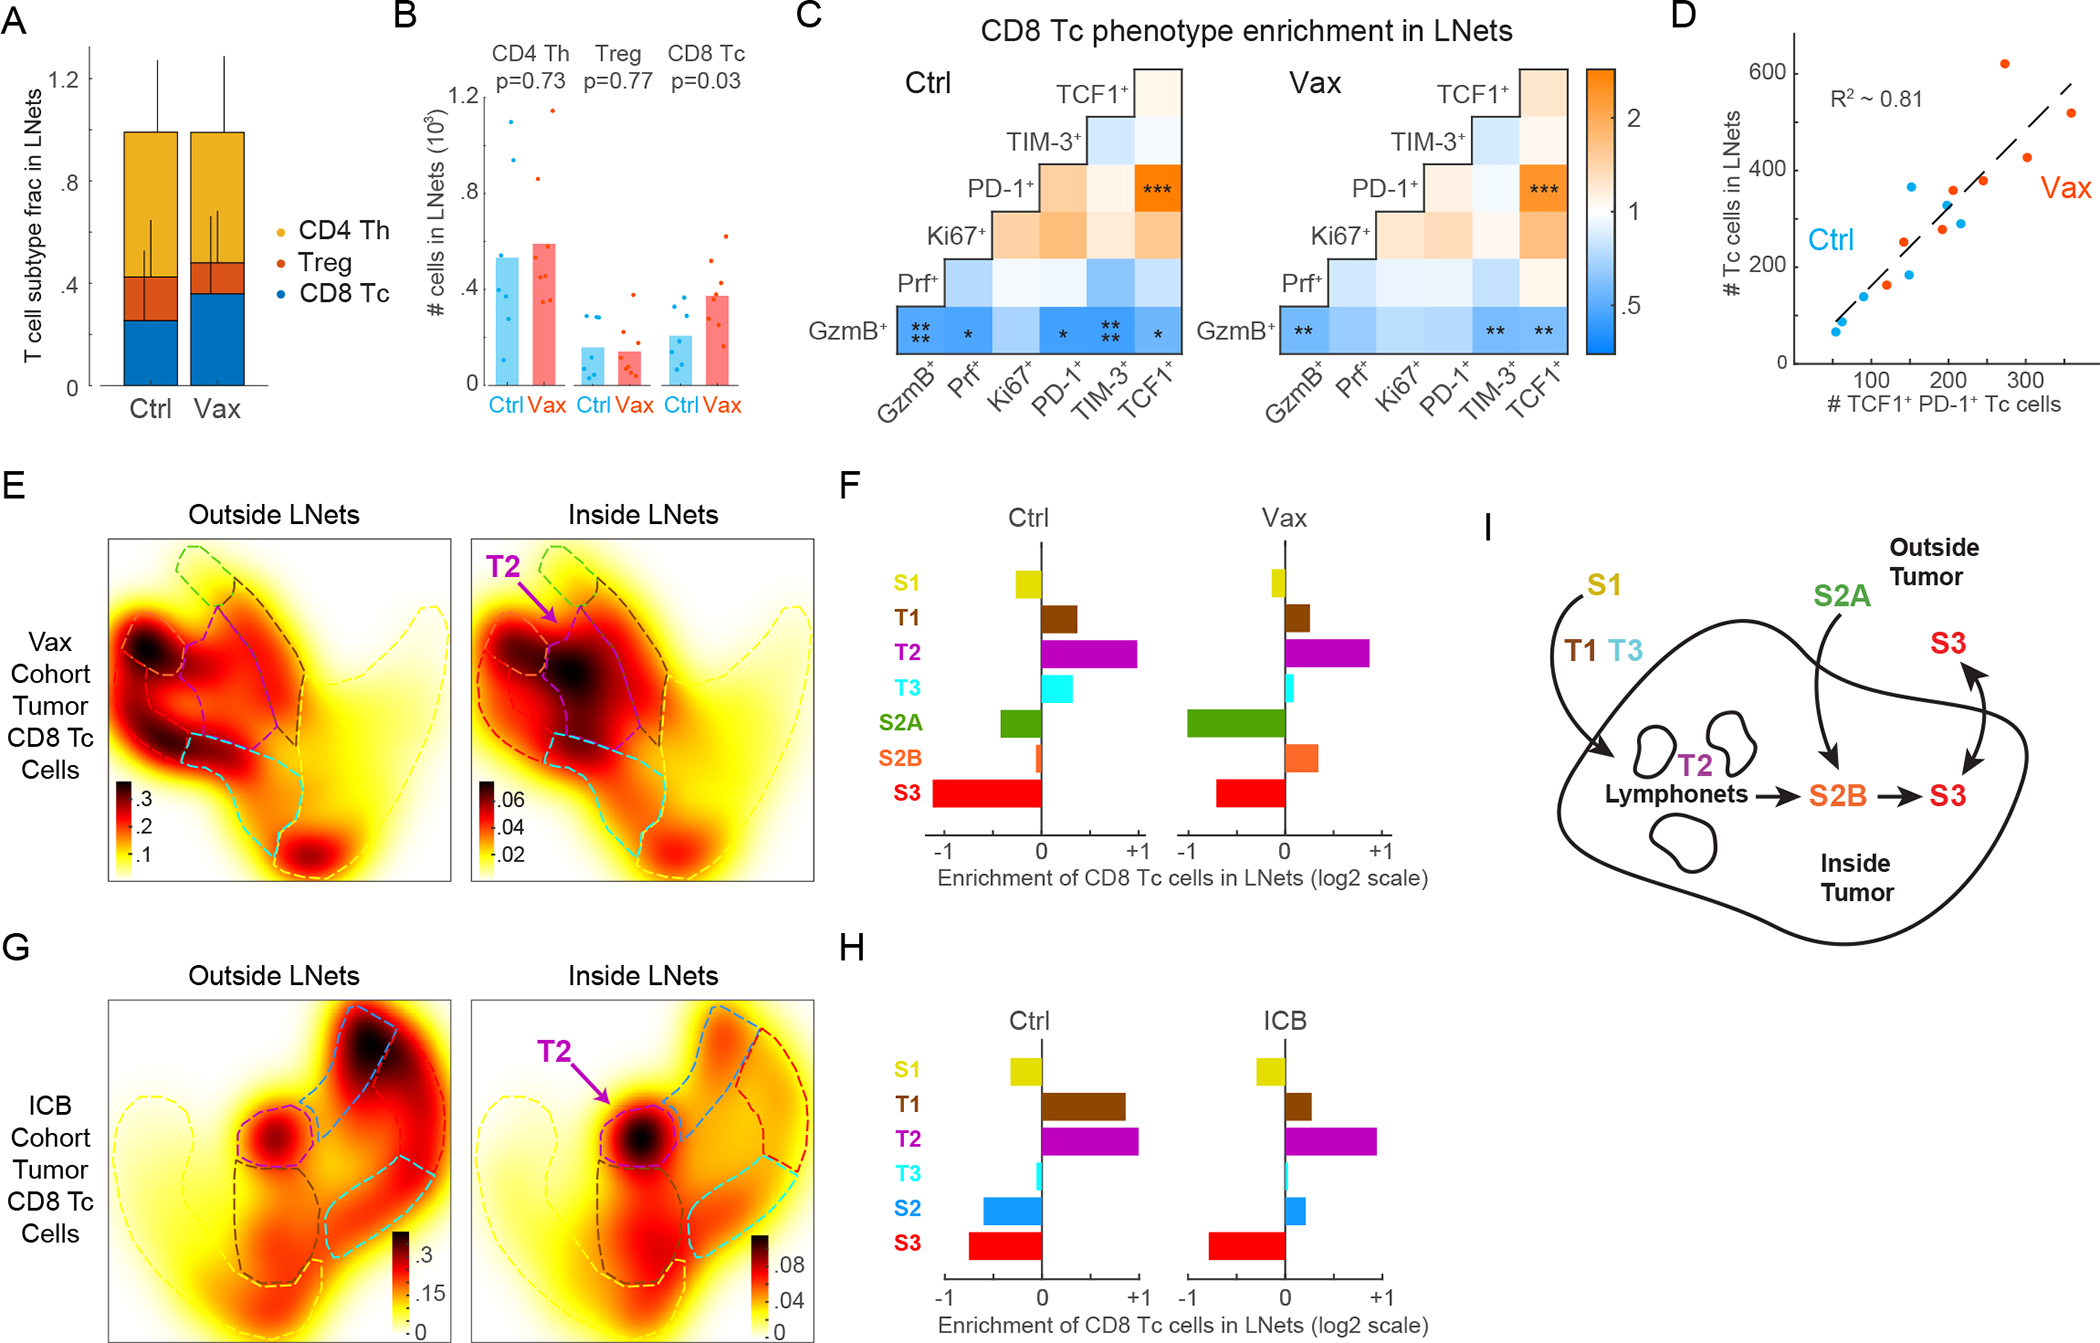
Figure 6. TCF1+ PD-1+ progenitor CD8+ T cells reside within intratumoral lymphonets.

(A) Proportion of T cell subtypes in lymphonets (Ctrl n=7, Vax n=8 mice, mean+SD, same LucOS cohort in Figure 5). (B) Number of T cell subtypes present in lymphonets (bar=mean, two-tailed t-test). (C) Pairwise enrichment analysis of marker co-expression in Tc cells in Ctrl and Vax groups (KS p-value *p<0.05,**p<0.01,***p<10−3,****p<10−4). (D) Plot of Tc cells present in lymphonets versus TCF1+ PD-1+ cells in Ctrl and Vax per mouse (dotted line, linear regression, R2=0.81). (E) Heat map of cell densities of tumor-localized Tc cells present outside and inside lymphonets in Palantir projections for Vax-treated cohort (n=3,736 and 806 cells, respectively). (F) Enrichment of tumor-localized Tc cells in lymphonets for Ctrl and Vax mice. (G) Heat map of cell densities of tumor-localized Tc cells present outside and inside lymphonets in Palantir projections for anti-PD-1 and anti-CTLA-4 treated (ICB) cohort (n=6 mice/group, n=4,276 and 1,041 cells, respectively). (H) Enrichment of tumor-localized Tc cells in lymphonets for Ctrl and ICB mice (n=6 mice/group). (I) Schematic of data interpretation from Figures 5 and 6. See also Figure S6 and Table S2.
