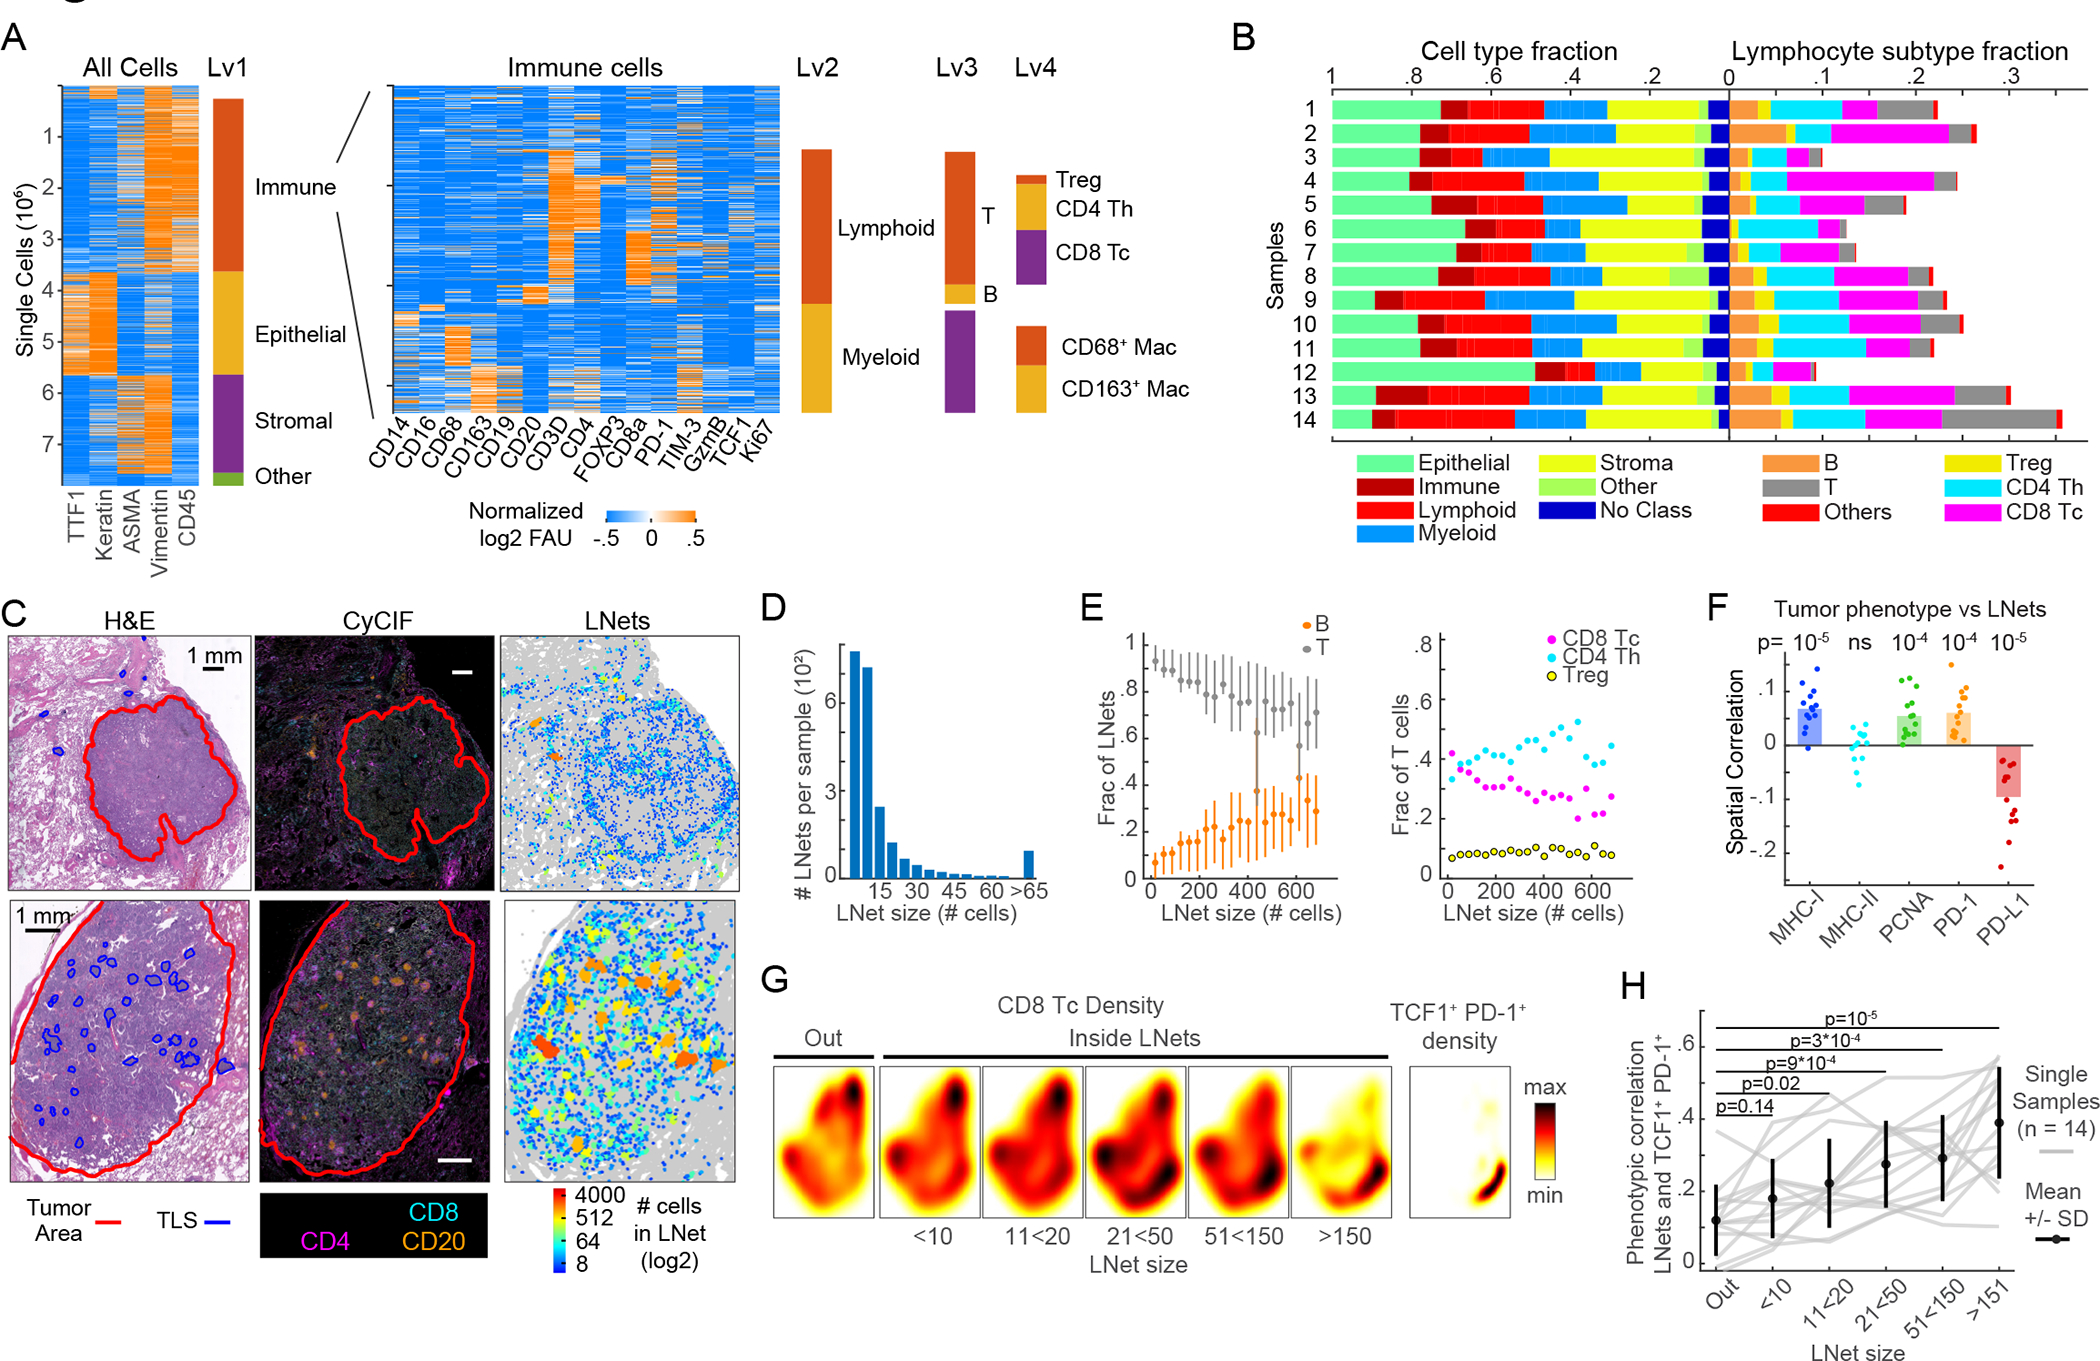
Figure 7. Lymphonets enriched for TCF1+ PD-1+ progenitor CD8 T cells are abundant in early-stage human lung adenocarcinoma.

(A) Sequential clustering of immune, epithelial/tumor, stromal and ‘other’ cell populations (Lv1); immune cells were further clustered into lymphoid and myeloid (Lv2) and immune subsets (Lv3, Lv4). Rows=individual cells. 7.8 × 10⁶ cells plotted from n=14 human lung adenocarcinomas. Immune clusters shown in heat map (right). (B) Horizontal-stacked bar graphs of cell-type fractions (Lv1–2) and lymphocyte-subtype fractions (Lv3-Lv4). (C) H&E, CyCIF representative images; map indicates lymphonet size. Top: tumor with small lymphonets (n<64 cells). Bottom: tumor with large lymphonets (n>64 cells). Scalebar: 1mm. (D) Histogram: average number of lymphonets/sample (n=14) by lymphonet size. (E) Composition of lymphonets by lymphocyte type across different network sizes (mean±25th percentile). (F) Spatial correlation of lymphocytes’ likelihood of belonging to a lymphonet and the likelihood of non-lymphoid cells expressing the indicated markers (n=14 samples, bar=mean, Pearson correlation and p-values). (G) Heat map of density of total Tc in and out of lymphonets of different sizes; density of TCF1+ PD-1+ CD8+ T cells in Palantir projection from 14 human lung adenocarcinomas (n=21*103 cells sampled from n=14 samples). (H) Phenotypic correlation of Palantir distributions of TCF1+ PD-1+ CD8+ Tc cells and lymphonets binned by lymphonet size (correlation of likelihood of CD8+ Tc belonging to a lymphonet (binned by size) and the likelihood of CD8+ Tc being TCF1+ PD-1+); gray lines represent data from individual tumors (n=14, n=3000 cells/sample); black line=mean±SD; Pearson correlation and two-tailed t-test. See also Figure S7, Tables S3 and S4.
