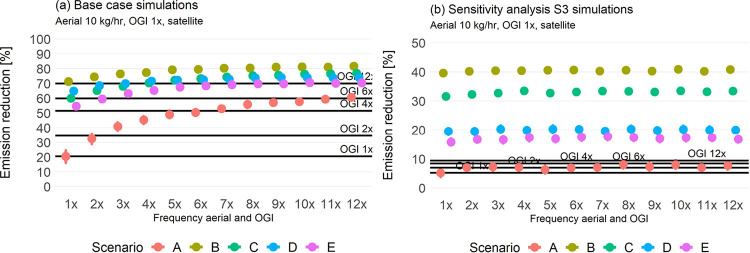
Figure 3.
Emission reduction of LDAR scenarios with satellite + aerial + OGI for (a) base case (long duration of high-emitters) and (b) sensitivity analysis S3 (short duration of high-emitters) simulations. Scenario A is no satellite. Scenario B is satellite with 50 kg/h and daily revisit times. Scenario C is satellite with 100 kg/h and daily revisit times. Scenario D is satellite with 50 kg/h and weekly revisit times. Scenario E is satellite with 100 kg/h and weekly revisit times. Horizontal black lines indicate the reduction of OGI-only LDAR programs. The horizontal axis represents the frequency of aerial and OGI; OGI is used only once a year in all scenarios, so the variation on frequency is due to the aerial surveys.

