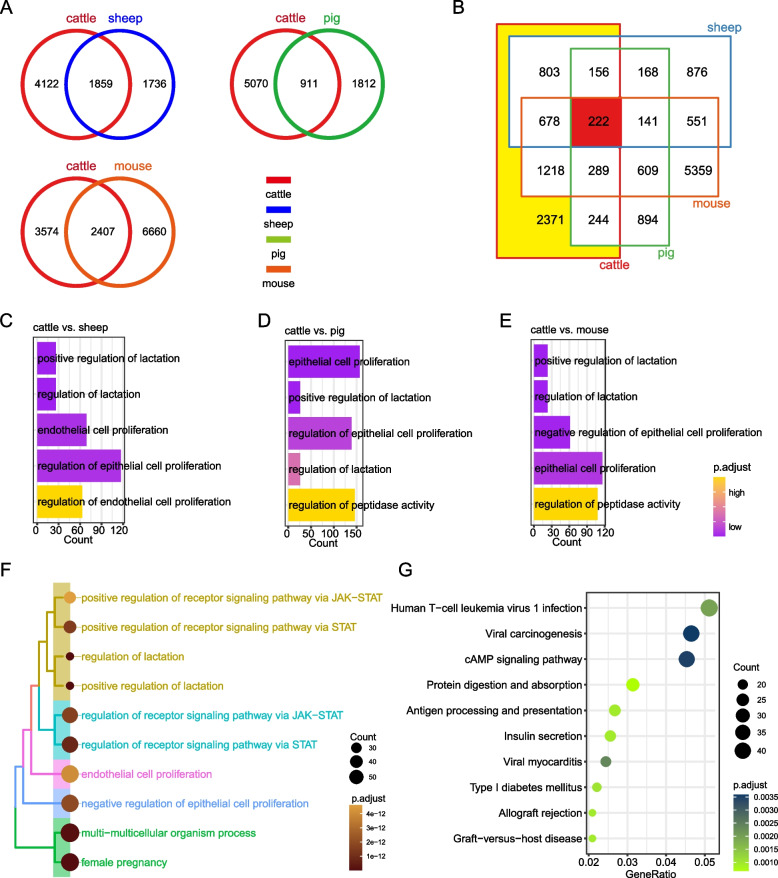
Fig. 3.
Comparative transcriptome analysis of oocyte development in cattle and other species. A Bicyclic Venn diagram showing transcriptional differences in cattle compared to other species alone during GV to MII. B Four-ring Venn diagram showing transcriptional differences in a comprehensive comparison of cattle and other species during GV to MII; red means cattle, blue means sheep, green means pig and orange means mouse. C-E Top 5 gene ontology (GO) terms of bovine-specific genes compared to sheep (C), pig (D) and mouse (E). F Top 10 GO terms of bovine-specific genes compared comprehensively with other species. G Top 10 Kyoto Encyclopedia of Genes and Genomes (KEGG) pathways of bovine-specific genes compared comprehensively with other species

