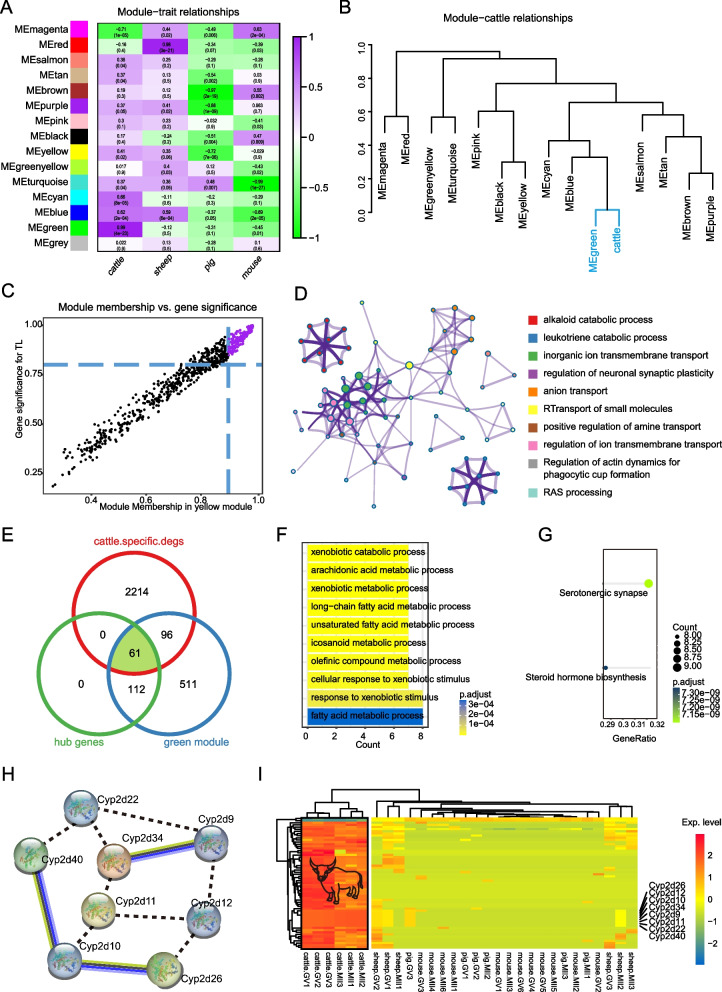
Fig. 6.
Identification of unique transcriptomic signatures in bovine oocyte development. A Heatmap showing the relationship between module and each trait; purple represents positive correlation, green represents negative correlation. B Hierarchical clustering plot showing the relationship between oocyte development of cattle and each module. C Scatter plot showing hub genes in green modules; purple dots represent hub genes and black dots represent non-hub genes within the green module. D Functional enrichment network of genes within green modules. E Three-ring Venn diagrams showing unique transcriptional signatures of bovine oocyte development. F Top 10 GO terms of 61 unique bovine transcriptional signature genes. G KEGG pathways of 61 unique bovine transcriptional signature genes. H The PPI network of unique bovine transcriptional signature genes. I Heatmap showing expression trends of 61 bovine-specific trait genes across multiple species

