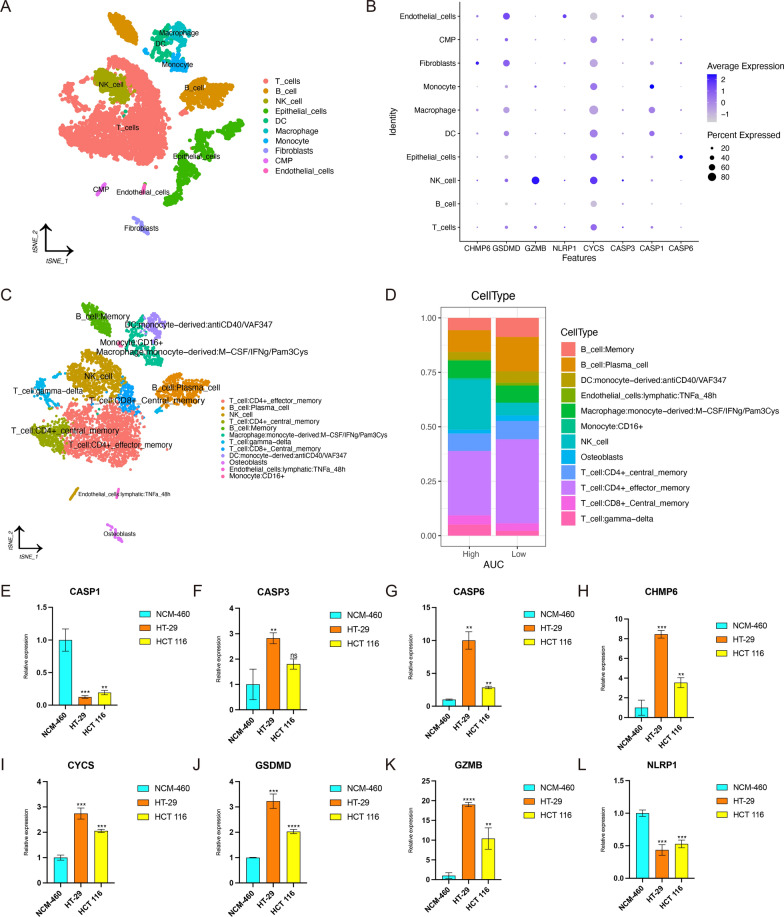
Fig. 7.
Exploration of pyroptosis-related genes by scRNA-seq data and RT-qPCR. A Cell annotation of clusters identified by t-SNE. B The expression of pyroptosis-related genes in cell subsets. C Cell annotation of immune cell subsets. D The proportion of different cell subsets in the low- and high-AUC groups. E–L Comparison of expression levels of genes between normal and CRC cell lines. E CASP1. F CASP3. G CASP6. H CHMP6. I CYCS. J GSDMD. K GZMB. L NLRP1. The top of error bar represents Mean + SD. The bottom of error bar represents Mean-SD. Lightblue represents NCM-460, coral represents HT-29, and yellow represents HCT 116. And ns means no significance; * means p < 0.05; ** means p < 0.01; *** means p < 0.001; **** means p < 0.0001

