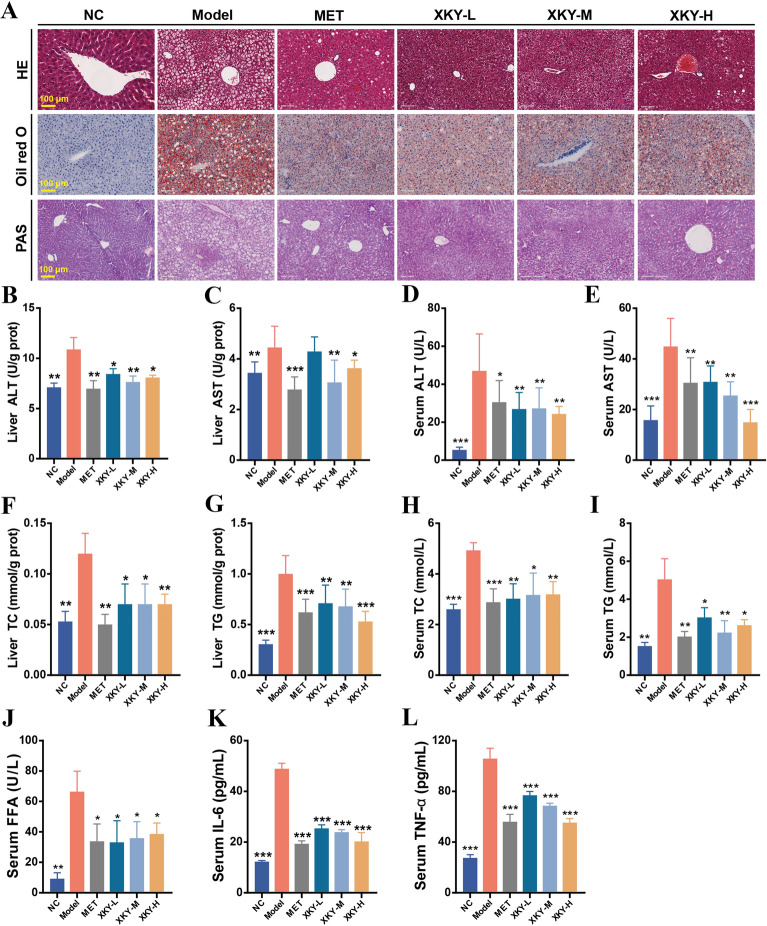
Fig. 3.
Effects of XKY on glucolipid metabolism and inflammatory cytokines in db/db mice. A Representative images of hepatic histopathological examination, Oil Red O staining and PAS staining in NC, Model, MET, XKY-H, XKY-M and XKY-L groups. Representative images were presented. Scale bar represents 100 μm. Levels of liver ALT (B), liver AST (C), serum ALT (D), serum AST (E), liver TC (F), liver TG (G), serum TC (H), serum TG (I), serum FFA (J), serum IL-6 (K) and serum TNF-α (L) in NC, Model, MET, XKY-H, XKY-M and XKY-L groups. Data were shown as means ± SD (n = 6, *P < 0.05, **P < 0.01, ***P < 0.001 vs. the Model group)

