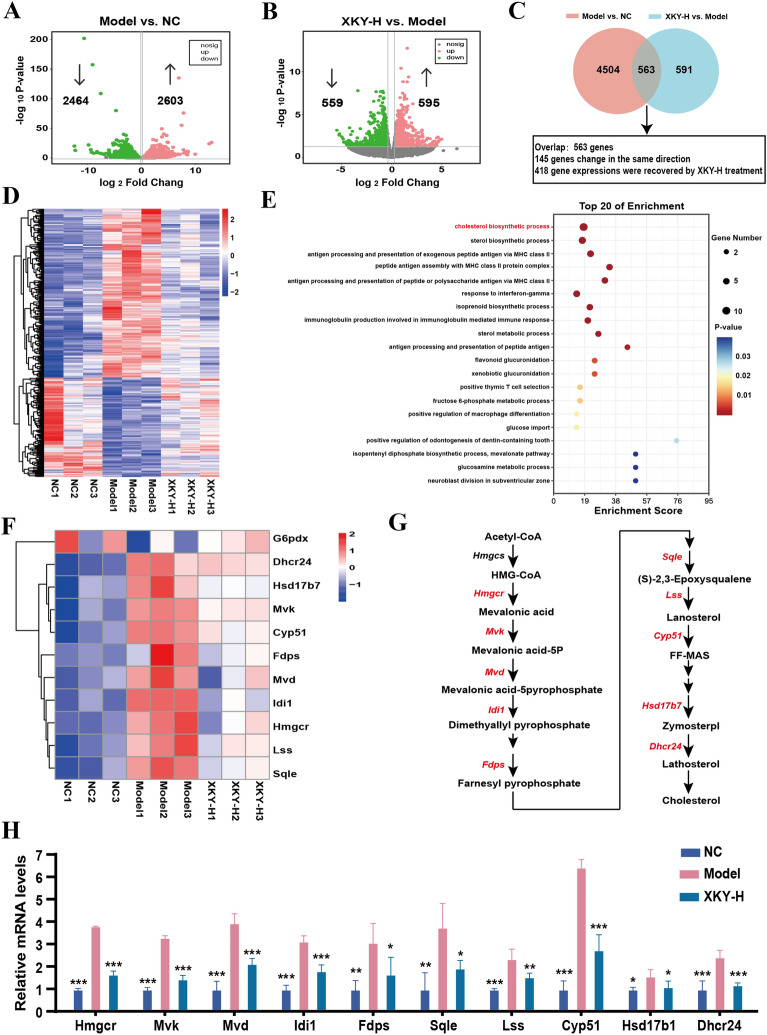
Fig. 4.
Effects of XKY on transcriptomic profiling of the liver in db/db mice. Volcano plot of the DEGs of the NC group vs. Model group (A), XKY-H group vs. Model group (B). Red color, green color, and grey color points indicated the significantly upregulated genes, downregulated genes and not significantly changed genes respectively. The gray dashed horizontal line indicated the FDR < 0.05, and the gray perpendicular dotted line indicated the |log2FC| > 0.5. C Venn diagrams showing the number of significantly DEGs in NC group vs. Model group and XKY-H group vs. Model group. D A cluster heatmap displays expression profiles of the significantly recovered DEGs by XKY-H treatment among the overlapped DEGs profiles in (C). E The top 20 of GO-biological process enrichment of the recovered DEGs profiles performed by DAVID online tool. F A cluster heatmap displays expression profiles of the recovered DEGs enriched in the cholesterol synthesis process. G Key DEGs (red text) involved in the process of cholesterol synthesis. (H) Relative mRNA expression of key DEGs involved in cholesterol synthesis process. Data were shown as means ± SD (n = 3, *P < 0.05, **P < 0.01, ***P < 0.001 vs. the Model group)

