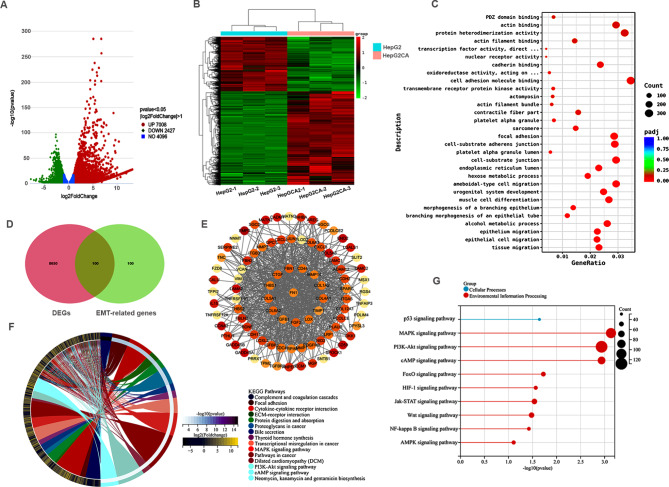
Fig. 2.
Differentially expressed genes and their function enrichment analysis in cantharidin treated HepG2 cell. (A, B) volcano plot and heat map visualization of the differentially expressed genes after cantharidin treatments in HepG2. Red represents upregulation genes; green represents downregulation genes. (A) Volcano plot of genes. (B) Heat map of differentially expressed genes that logFC > 1, <-1, p < 0.05. (C) GO enrichment of differentially expressed genes. (D) The EMT related genes after cantharidin treatment HepG2 cell was screened using venn diagram. (E) PPI network of EMT related genes. (F) KEGG enrichment of the differentially expressed genes after cantharidin treatment in HepG2 cell. (G) Top 10 significantly enriched signaling pathways in cantharidin treated HepG2 cell

