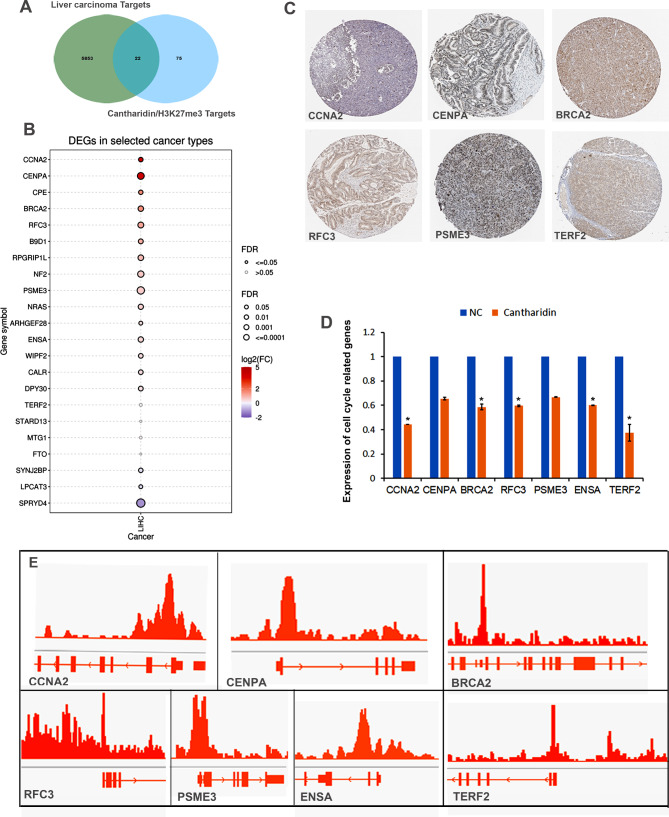
Fig. 4.
H3K27me3 related cantharidin treatment target prediction analysis in HCC. (A) Venn diagram shows the genes of liver carcinoma and H3K27me3 related cantharidin treatment targets. (B) The expression of these targets in LIHC. Red represents high expression; blue represents low expression. P < 0.05 is considered significant. (C) Proteins expression of significantly up-regulated genes in LIHC. (D) These genes expression in cantharidin treated HepG2 cell. The * P < 0.05 was regarded as statistically significant. (E) H3K27me3 is dramatically enriched in these genes promoters based on the ChIP-seq results in HepG2

