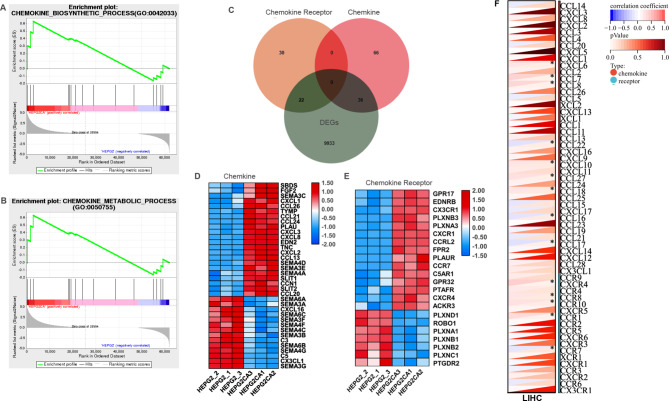
Fig. 5.
The cantharidin treatment affects chemokine related immune response. (A, B) GO functional annotation shows that cantharidin treatment is positively associated with chemokine biosynthetic and metabolic processes based on GSEA analysis. (C) Venn diagram shows that the differently expressed genes of chemokine and chemokine receptor in the cantharidin treated HepG2 cell. (D, E) The heatmap shows the expression of chemokine (D), and chemokine receptor (E) in the differently expressed genes of cantharidin treated HepG2 cell. (F) The heatmap shows the association of chemokine and chemokine receptor with EZH2 in LIHC, * P < 0.05 was regarded as statistically significant

