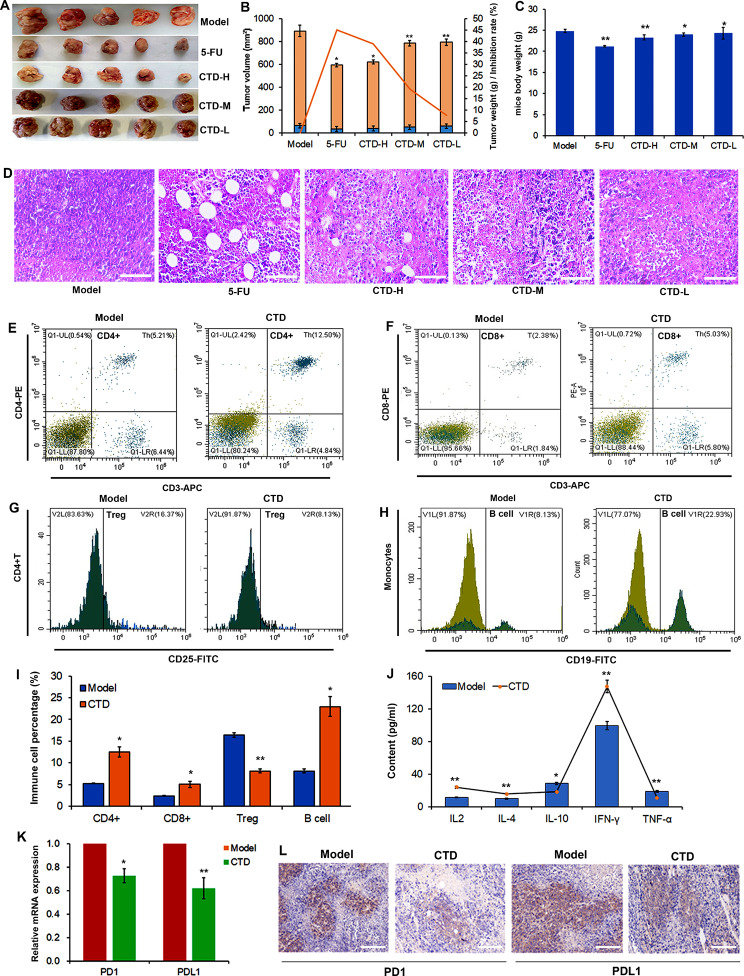
Fig. 7.
The cantharidin improves antitumor immunity in mice. (A) Cantharidin represses the tumor cell growth in vivo.(B) Statistics of the tumor volume, weight, and inhibition rate in mice after therapy with cantharidin and 5-FU. Cantharidin and 5-FU have similar inhibitory effects on tumor growth. Data are presented as the mean ± SD (n = 3), * P < 0.05, ** P < 0.01 vs. the control group. (C) The mice body weight of different model groups. (D) The H&E staining of tumor tissues, including model, 5-FU, CTD high, middle, and low groups. (E-I) Proportion of CD4+ (E), CD8+ (F), Treg (G), and B cell (H) in mice after therapy with cantharidin. To detect the immune cells, blood samples are collected from each treatment group. Cells are stained with anti-CD4, anti‐CD8, anti-CD25, and anti-CD19 antibodies and analyzed by flow cytometry. (I) Statistics of the frequency CD4+, CD8+, Treg, and B cell in mice blood. (J) Elisa assay confirms the expression of immune related genes, IL-2, IL-4, IL-10, TNF-γ, and TNF-α. (K) RT-PCR analyses the expression of PD1 and PD-L1 in the tumor tissues. The * P < 0.05, ** P < 0.01. P value of < 0.05 was regarded as statistically significant. (L) Immunohistochemistry and quantitative analyses the expression of PD1 and PD-L1 in the tumor tissues after therapy with cantharidin

