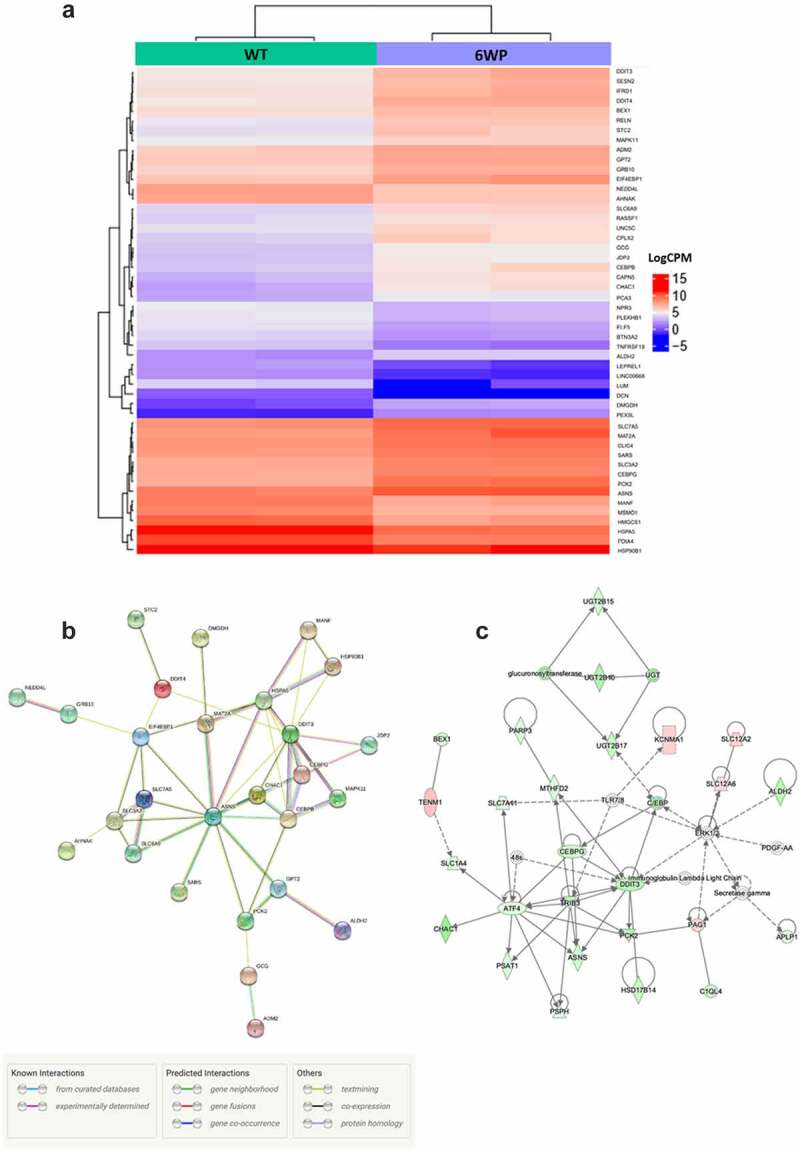
Figure 3.

Repeated DNA damage alters transcriptional profile of 22Rv1 cells. 22Rv1 cells were treated daily with 1 μg/ml of phleomycin for 6 weeks (6WP) or left untreated (WT, AM). RNA was extracted and sequenced on the Illumina NovaSeq 6000 platform by the AGRF to generate 100 bp single end reads. A) Heatmap of log count per million (logCPM) values for the top 50 differentially expressed genes based on adjusted p-values. High gene expression is indicated by red and low expression is indicated by blue. Genes and experimental samples with similar expression patterns are clustered together. B) STRING pathway analysis showing interactions between the top 50 genes. C) The most significant IPA network for differential gene expression. Direct (solid line) and indirect (dashed line) connections between the top 500 differentially expressed genes were formed. Green nodes indicate upregulation and red nodes indicate downregulation of the corresponding gene.
