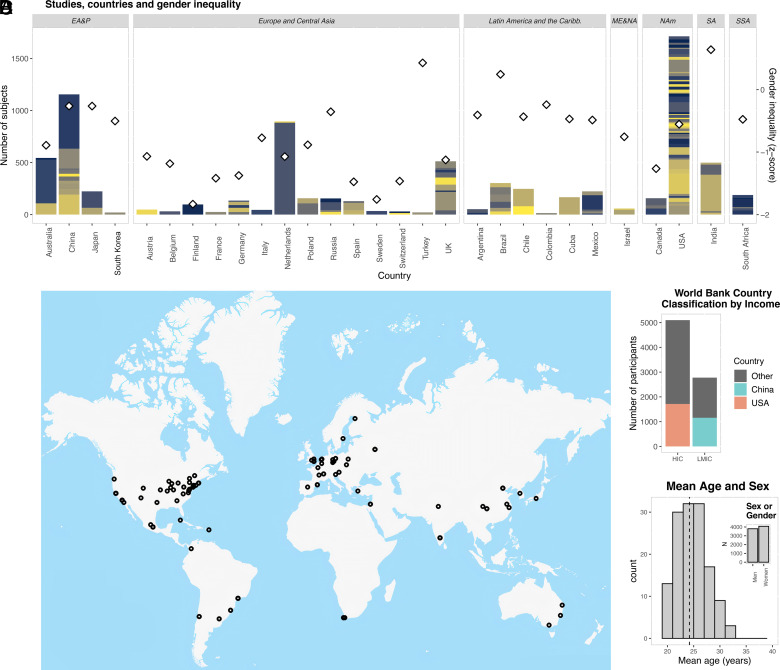
Fig. 2.
Demographic characteristics of samples included. (A) Number of participants included in each country (bars), with different colors denoting different studies/samples. The right Y axis and diamonds describe gender inequality Z-score, where higher values denote higher inequality. (B) Map showing the location of the main institutions that performed the studies included. (C) Number of participants from high-income countries (HIC) and low- and middle-income countries (LMIC), highlighting participants from China and the United States. (D) Histogram with mean age and sex within and across the samples, respectively. EA&P = East Asia and Pacific; ME&NA = Middle East and North Africa; NAm = North America; SA = South Asia; SSA = Sub-Saharan Africa.

