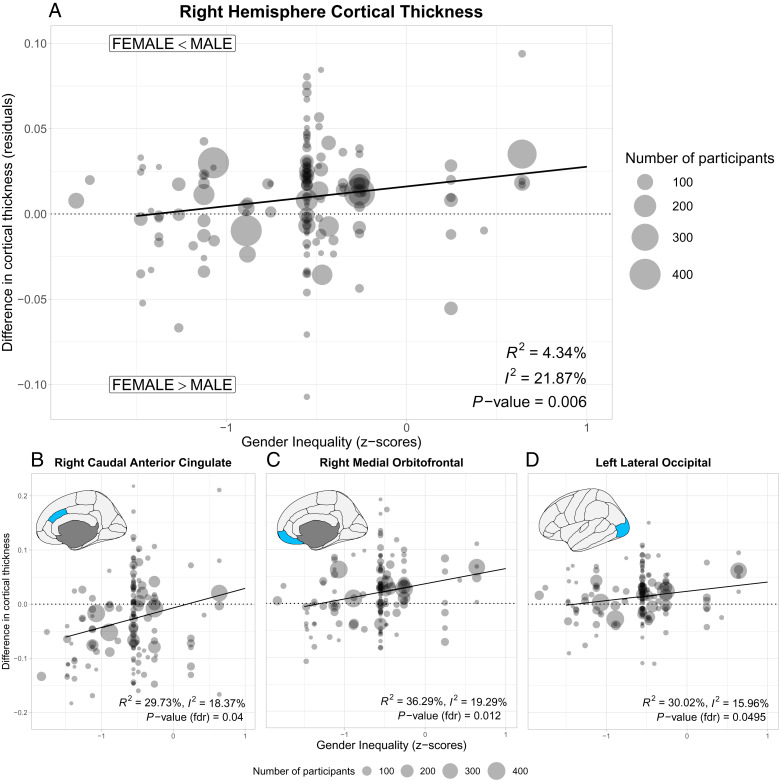
Fig. 3.
Associations between country-level gender inequality and the average difference of the cortical thickness between women and men. (A) Right hemisphere. Circles represent the thickness difference between men and women in a specific sample; their size represents the number of participants. Negative values of the gender inequality index describe a higher equality between men and women. Solid line represents fit of main analysis. (B–D) Significant associations between gender inequality and regional cortical thickness after controlling for multiple comparisons.

