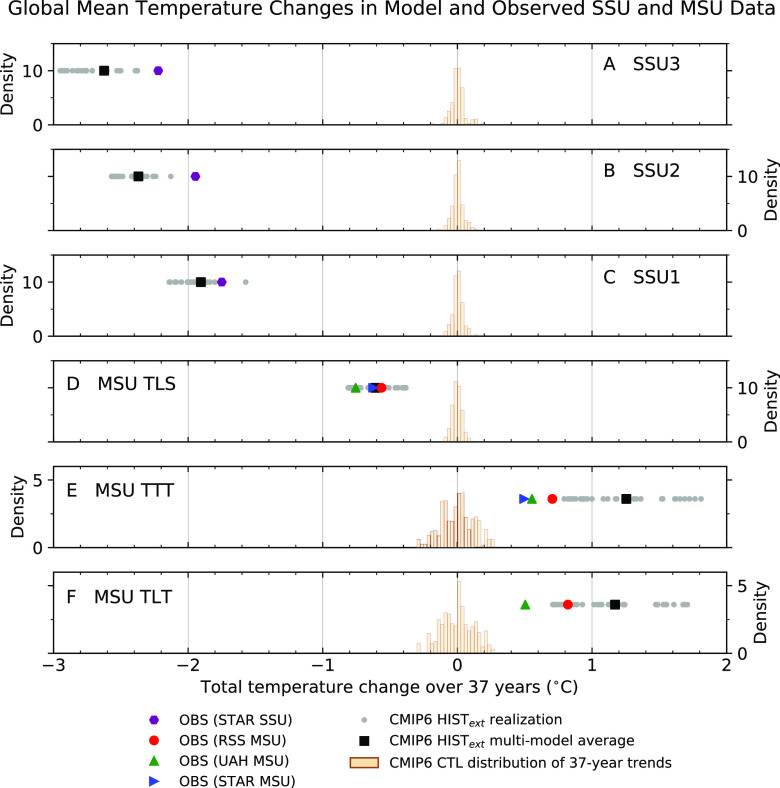
Fig. 2.
Total global-mean atmospheric temperature changes over 37-y periods. Results are for six different atmospheric layers, arranged vertically by the height of the layer with respect to the Earth’s surface (panels A–F). The total temperature change is the least-squares linear trend per year × 37 y, calculated over 1986 to 2022 for the HISText realizations and satellite observations and over 37-y nonoverlapping segments of preindustrial control runs. The latter provides estimates of the natural internal variability of atmospheric temperature trends inferred from nine different CMIP6 models. The same nine models were used to calculate the multimodel average synthetic SSU and MSU atmospheric temperature trends from 32 realizations of HISText runs with anthropogenic and natural external forcing. Trends from individual HISText realizations are also shown. See SI Appendix for details of control run trend distributions and sources of observed data. The y-axis location of the HISText trends and observed trends is arbitrary.

