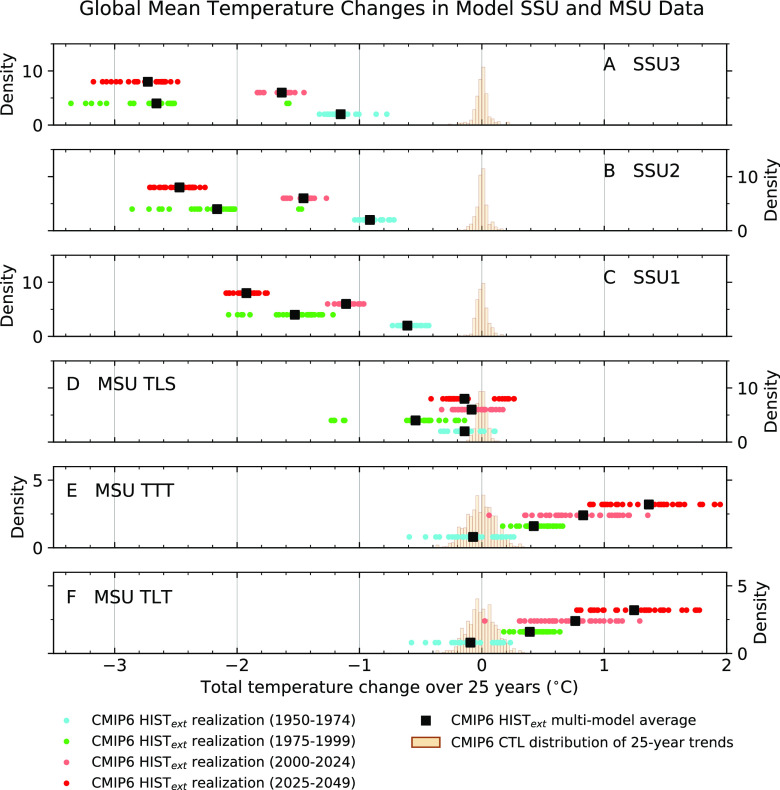
Fig. 3.
Sensitivity of global-mean atmospheric temperature changes to the choice of analysis period. Results are for the same six atmospheric layers shown in Fig. 2 (panels A–F). The total temperature change is the least-squares linear trend per year × 25 y, calculated over four different periods for the HISText realizations (1950 to 1974, 1975 to 1999, 2000 to 2024, and 2025 to 2049) and over 25-y nonoverlapping segments of CMIP6 preindustrial control runs. See Fig. 2 for analysis details and SI Appendix for details of control run trend distributions. The y-axis location of the HISText trends is arbitrary.

