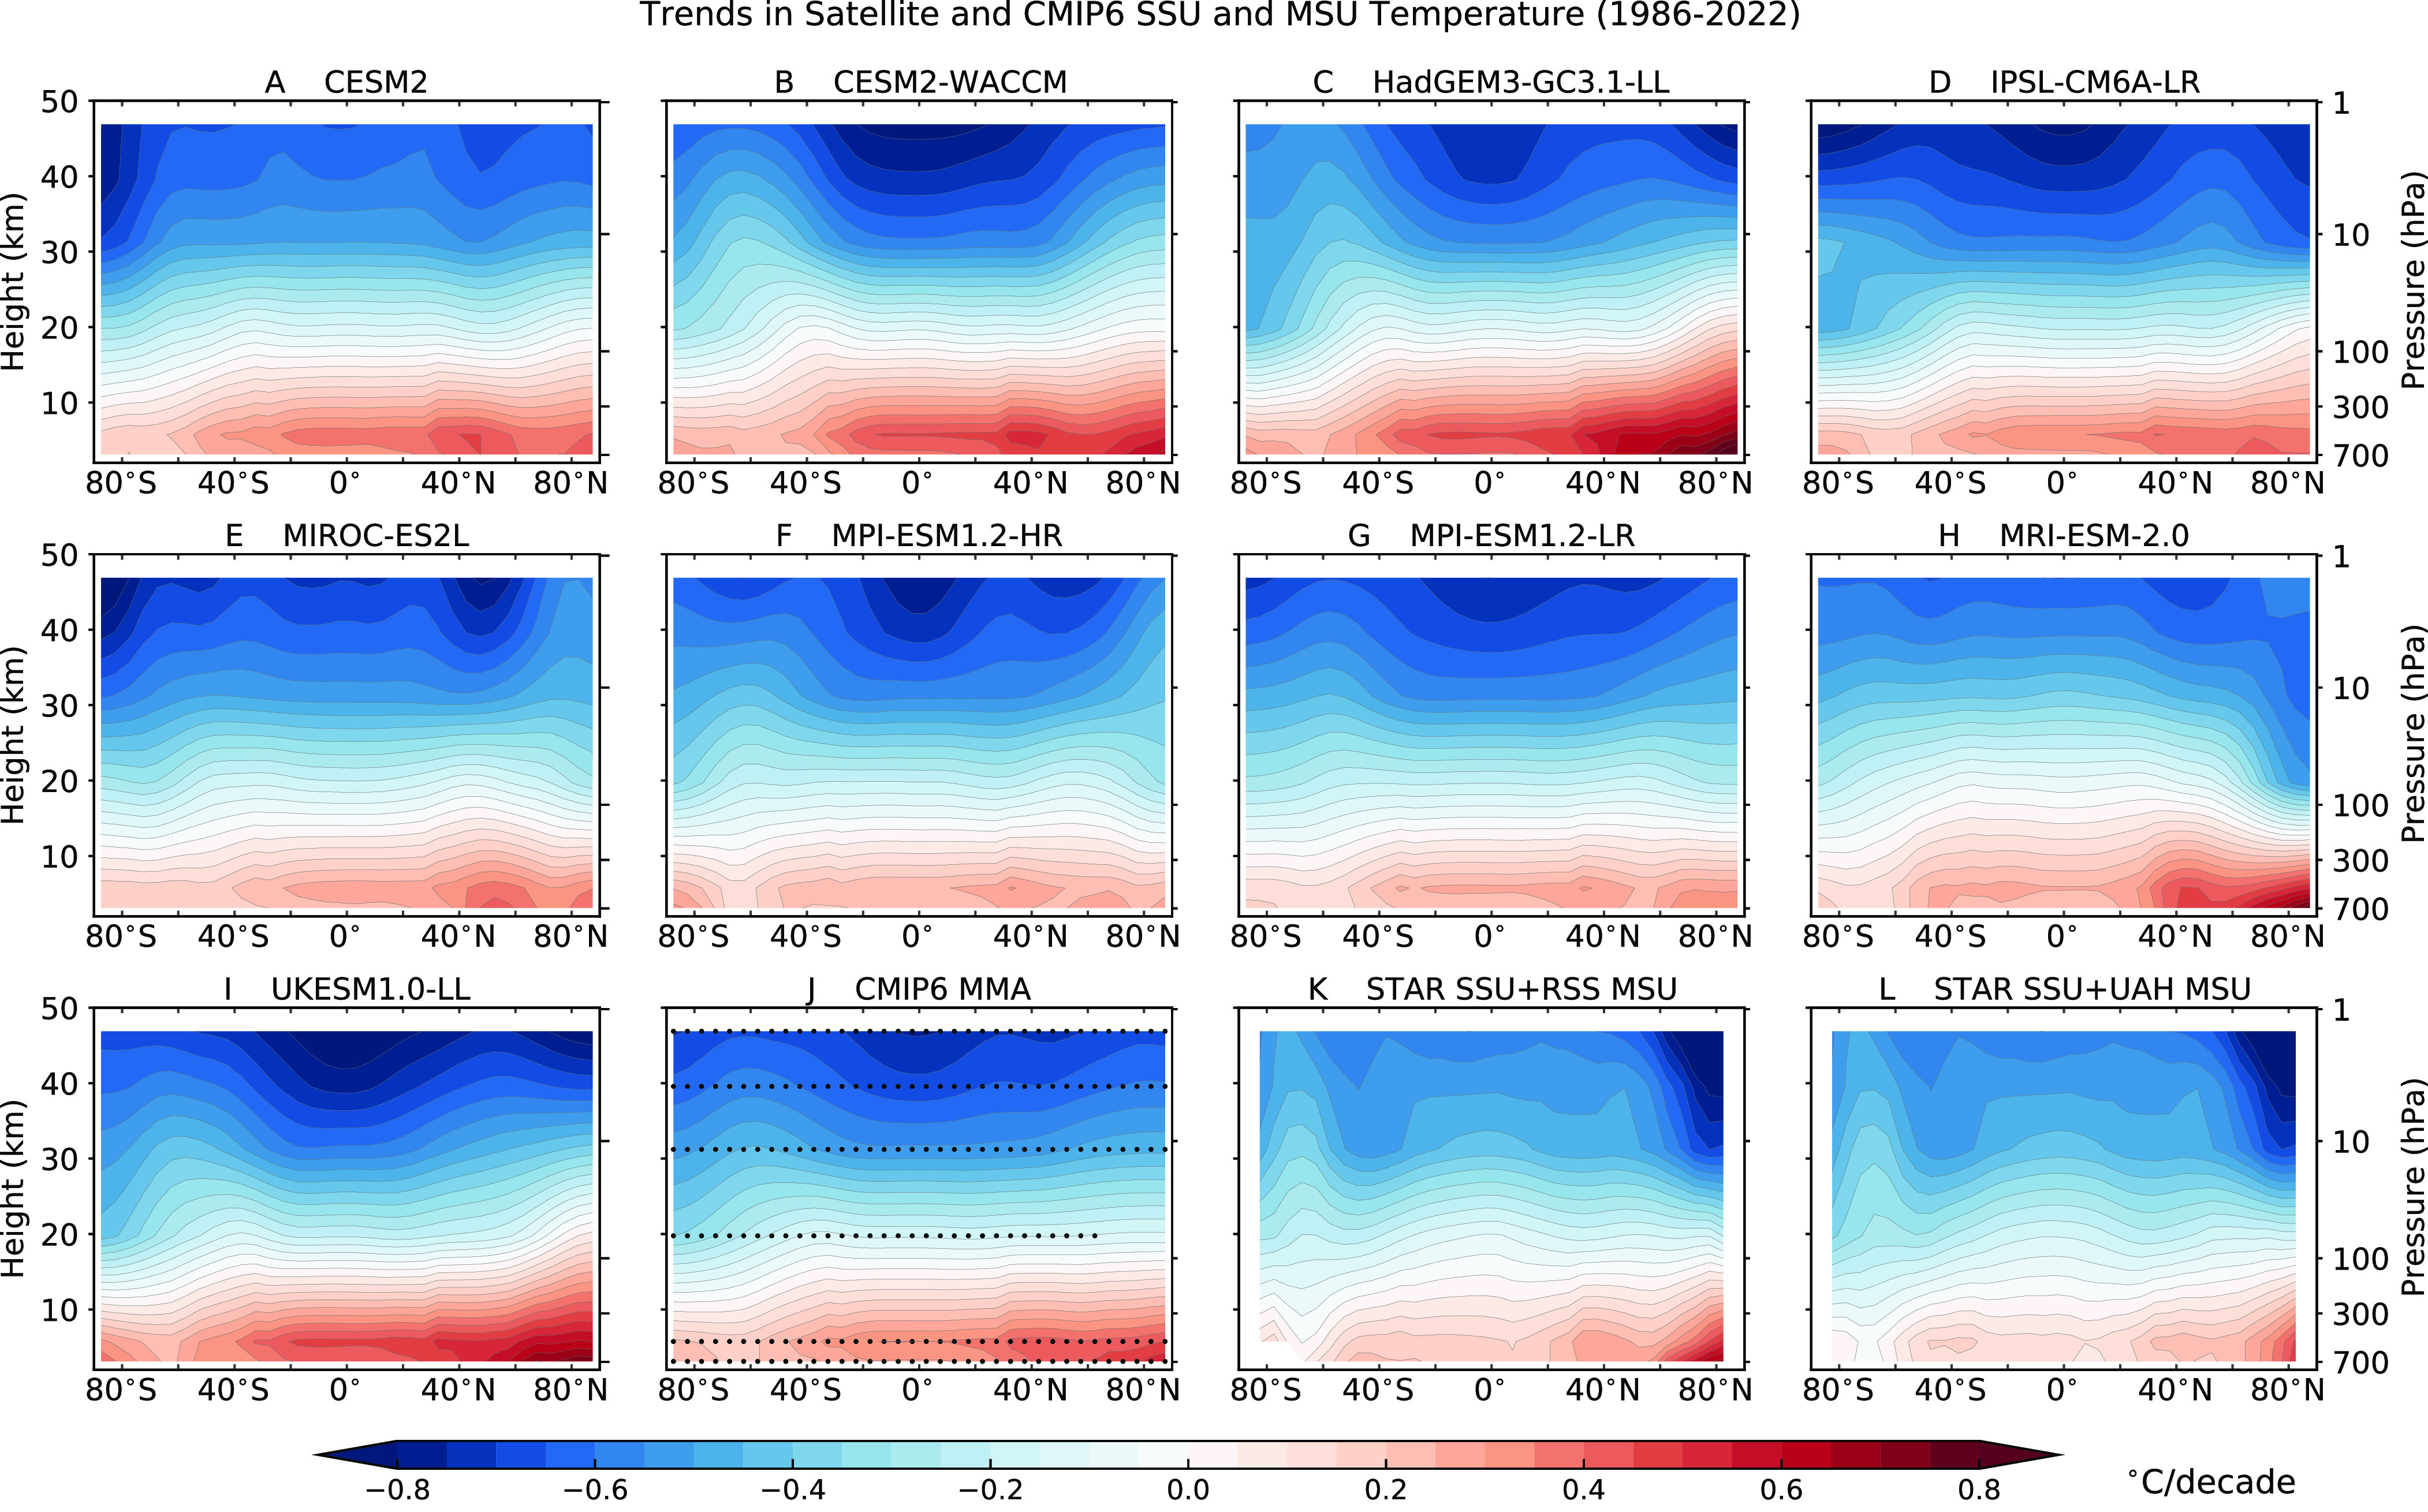
Fig. 4.

Simulated and observed latitude-height profiles of atmospheric temperature trends over 1986 to 2022 (in °C/decade). Trends were calculated from zonal-mean temperatures for the six atmospheric layers in Fig. 1. Trends are plotted at the approximate heights of the maxima of each weighting function peak and were smoothly interpolated in the vertical. Model results are for HISText simulations performed with nine different CMIP6 models (panels A–I). If more than one HISText realization was available for an individual model, the result in panels A–I is for the ensemble-mean trends. The CMIP6 multimodel average is also shown (MMA; panel J). Satellite observations are for SSU data combined with two different observed MSU datasets (panels K and L; Methods). Stippling in panel J denotes latitude bands and layers at which the local S/N ratio exceeds 2—i.e., where the CMIP6 MMA trend is two times greater than the between-model SD of the trend. The stippling indicates that at each latitude and for each of the six atmospheric layers, the MMA temperature trends are large relative to the between-model SD of trends. The sole exception is in TLS over the Arctic, where there are noticeable intermodel trend differences.
