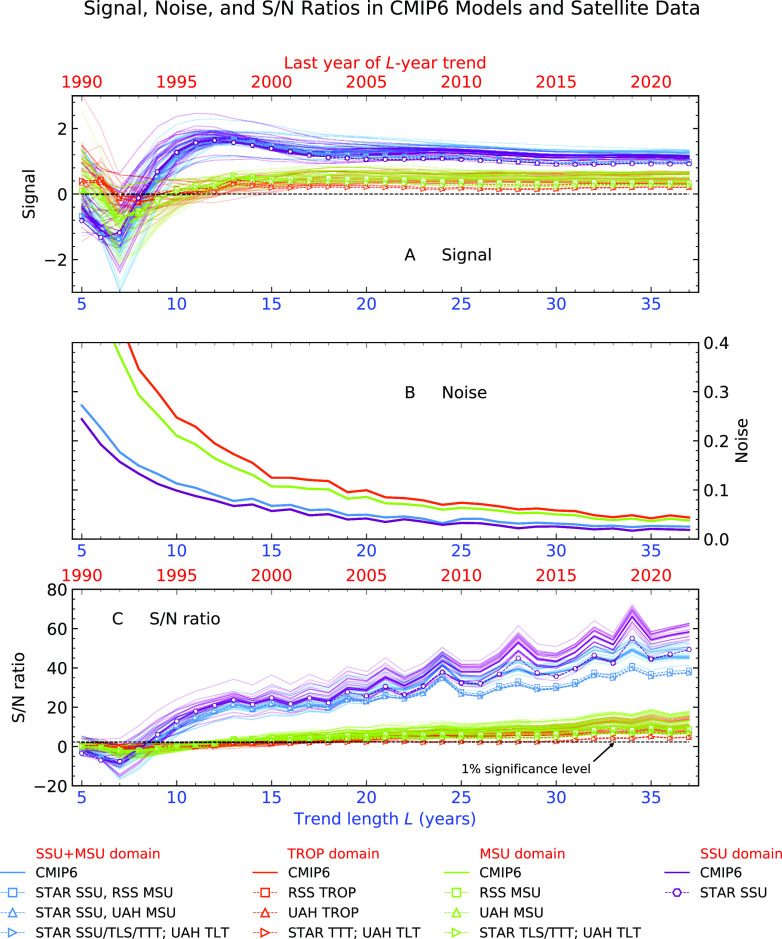
Fig. 5.
Signal, noise, and S/N ratios in model and observed SSU and MSU data. Signals were calculated by projecting temperature data for different sets of atmospheric layers onto four fingerprints (SSU+MSU, TROP, MSU, and SSU) estimated from CMIP6 HISText simulations, and then fitting trends of increasing length L years to the resulting projection time series (panel A). CMIP6 control run temperature data were projected onto the same four fingerprints, yielding the projection time series Nctl(t). The noise σctl(L) is estimated by fitting nonoverlapping L-year trends to Nctl(t) and calculating the SD of the L-year trend distribution (panel B). The S/N ratio is the L-year signal in panel A divided by the respective values of σctl(L) in panel B (Methods and SI Appendix). Model signals are from 32 HISText realizations; model noise is from 4,050 y of control run data. Signals and S/N ratios in which observed temperature data are used are plotted with symbols and dashed lines. The dashed horizontal line in panel C is the 1% significance level.

