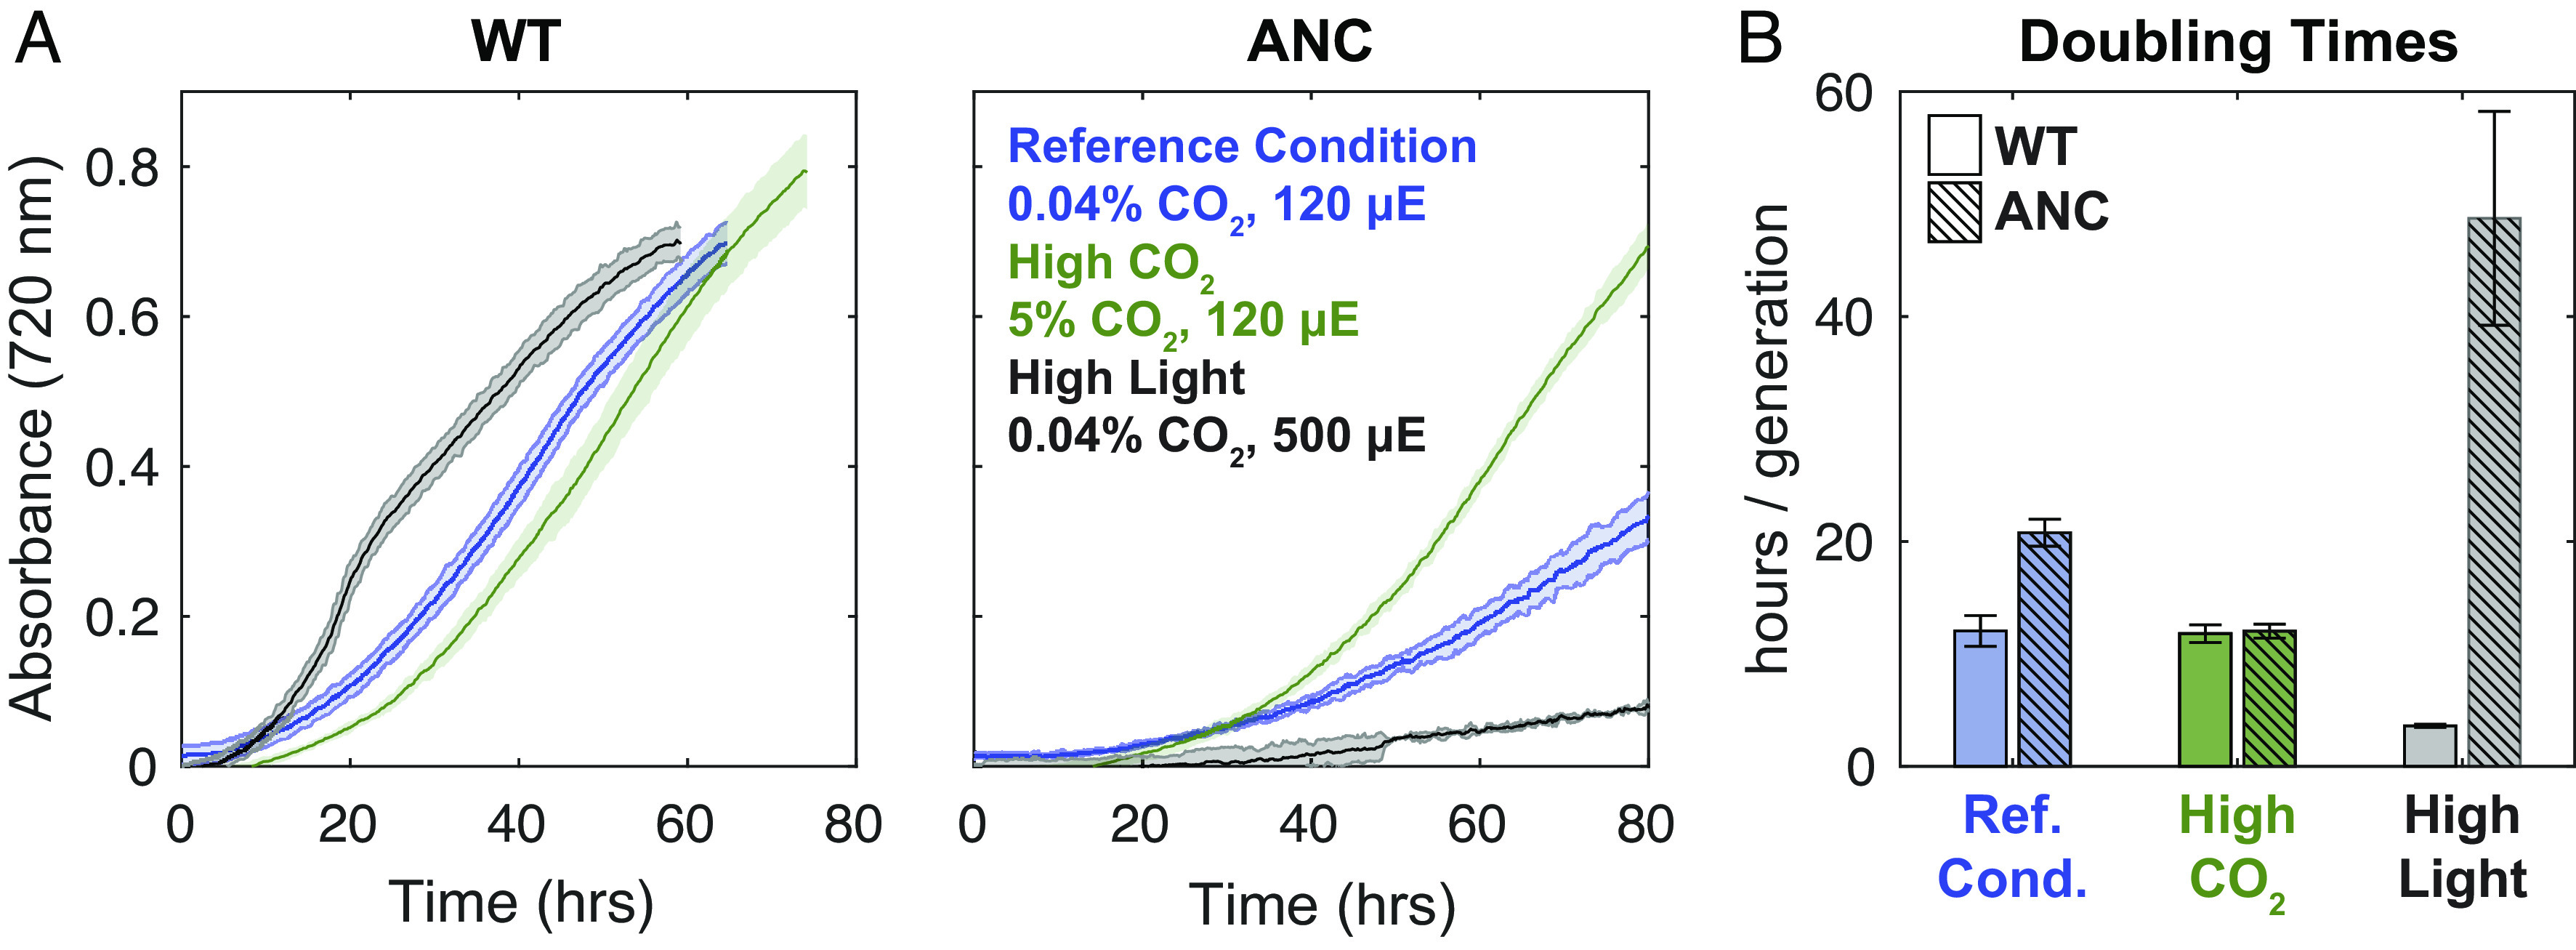
Fig. 2.

Growth curves for WT and ANC strains across experimental conditions. (A) Averaged growth curves shown for WT and ANC strains to 80 h, colored by growth condition as indicated in figure. Data were smoothed with a rolling median (Materials and Methods); see full ANC growth curves in SI Appendix, Fig. S12. (B) Average doubling times with SDs. See SI Appendix for details of doubling time calculation. ANC displayed a growth defect relative to the WT at the reference condition, which was rescued by high CO2. ANC grew slowest in high light, while WT grew fastest in that condition.
